New writing appears biweekly in the Chartography newsletter. Read and subscribe:
A selection of classic essays are presented below.
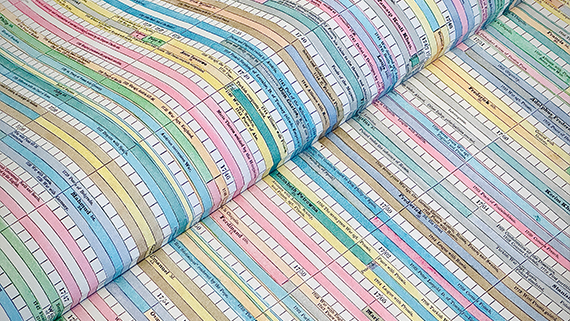
Colossal Chronography
Frances Harriet Lightfoot's 1831 marvel
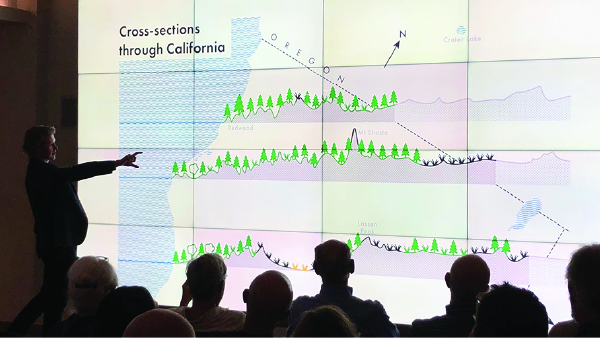
Profiling California
A new map in a classic Isotype style.
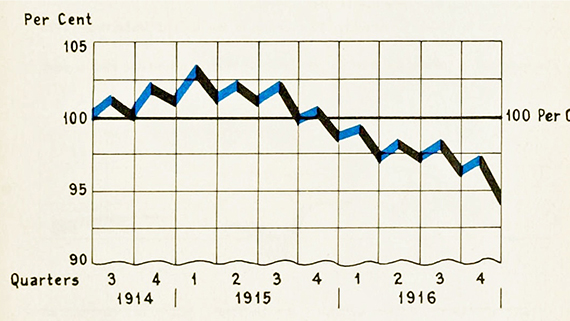
Standards for Graphic Presentation
Seventeen ways to improve data viz from 1915.

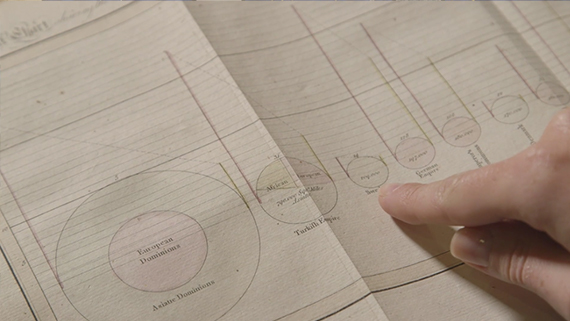
"An Appeal to the Eye"
William Playfair promotes his charts.
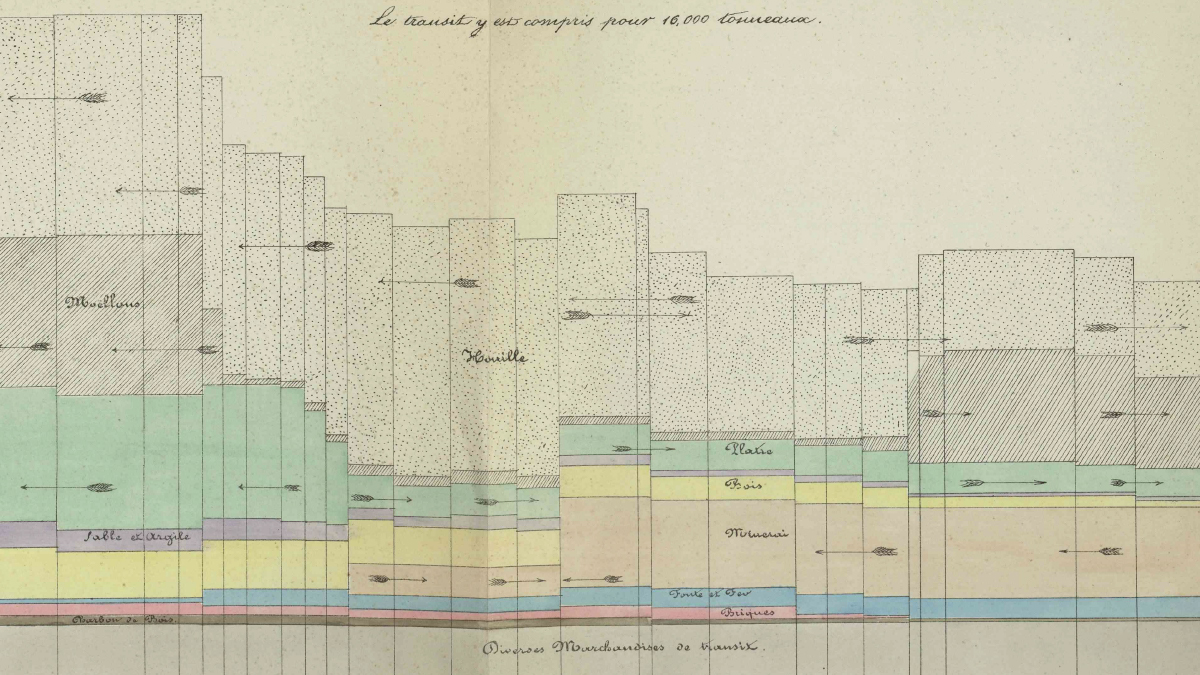
"Illustration Invades Everything"
Reflections by Minard on his graphical impact.
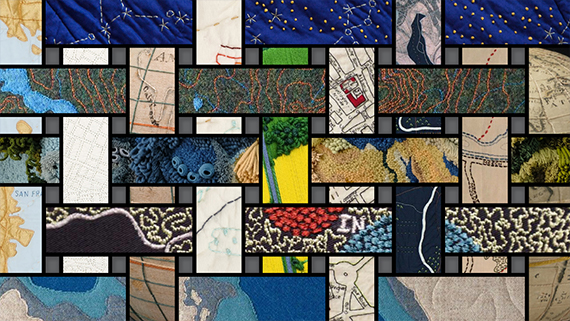
Couture Cartography
These hand-stitched maps will fill you with wonder.
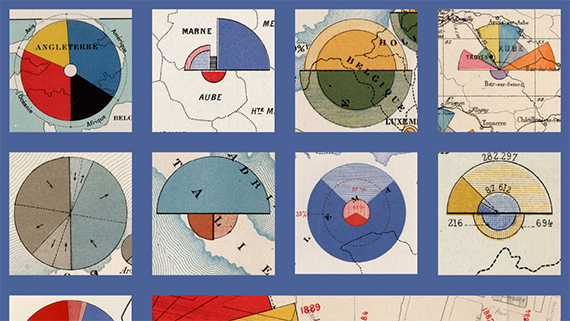
Classic Map Color Design
Inspiration from the Albums de Statistique Graphique.
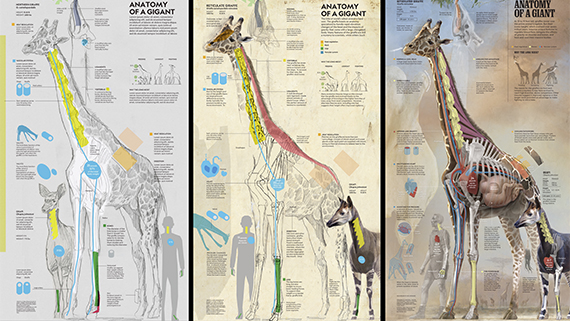
Dissecting 'Anatomy of a Giant'
Design interview with Fernando G. Baptista.
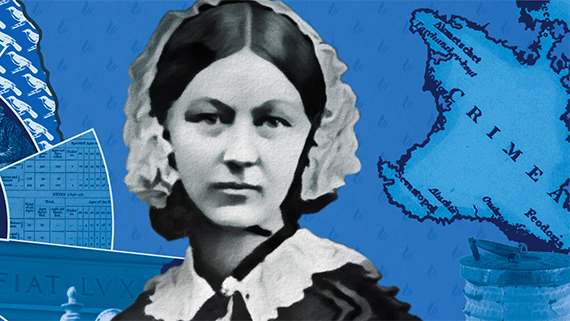
Florence Nightingale is a Design Hero
May her light forever shine bright.
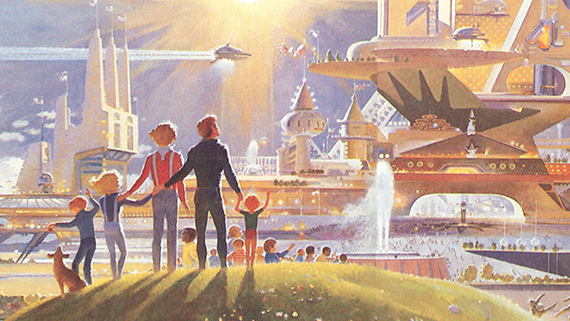
Making Neil and Buzz
Designing an interactive scrolly.

Tear Up Your Baseline
A design flourish for line charts.
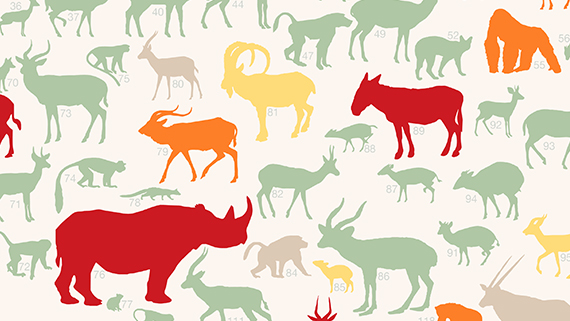
Making Endangered Safari
Inspiration and encoding behind-the-scenes.
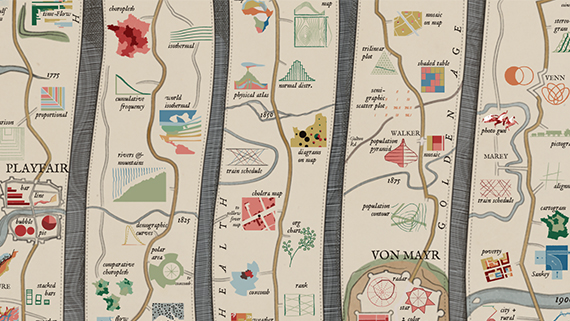
Interacting With History
300 years of information graphic milestones.
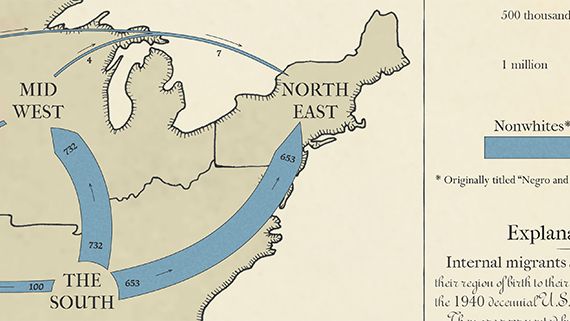
Picturing the Great Migration
In the style of Minard and in the spirit of Du Bois.
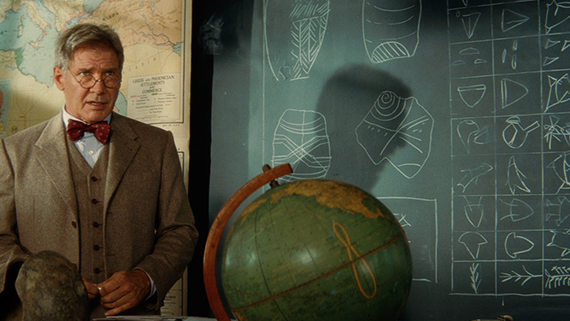
Data Viz in the Movies
How information graphics benefit feature films.
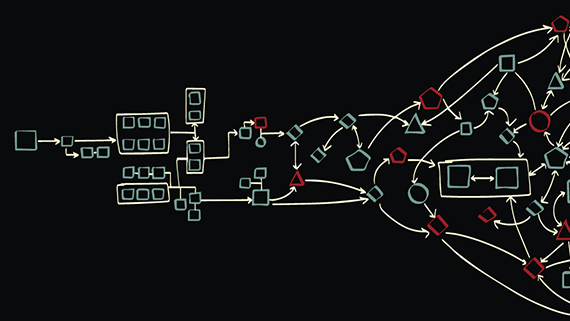
Complex Curiosity
How to renounce control and embrace the world.
Turning Data Into Cash
Creating meaningful businesses.
Make a Book in 80 Weeks
The numbers from pitch to publication.
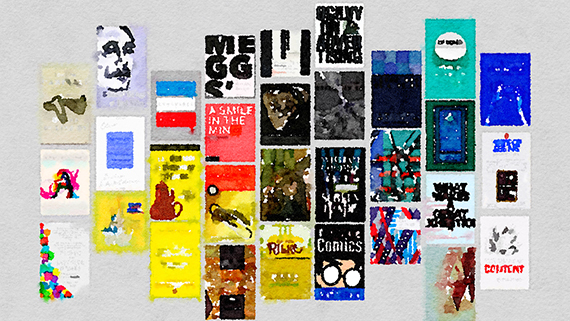
Book Cover Design
Attract, differentiate, and convey what's inside.

Writing is Hard
Anxiety and gratitude for a challenging technology.
Essential Information Arts
Books without data for the data professional.
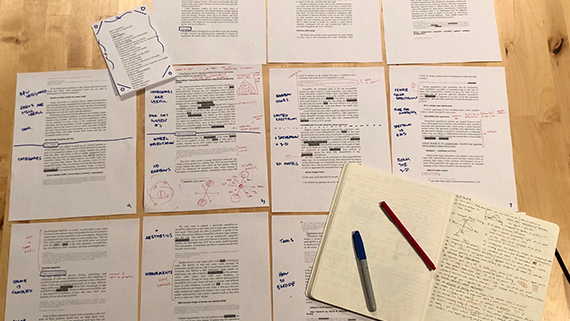
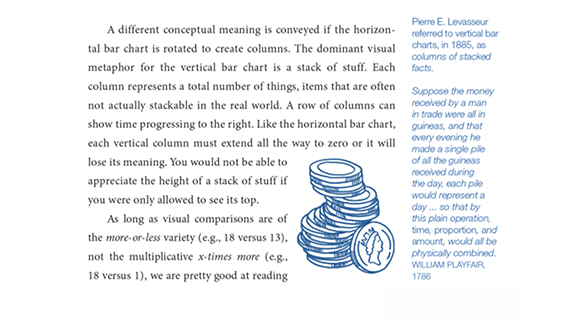
Multiple Book Narratives
Weaving text, marginalia, and illustrations.
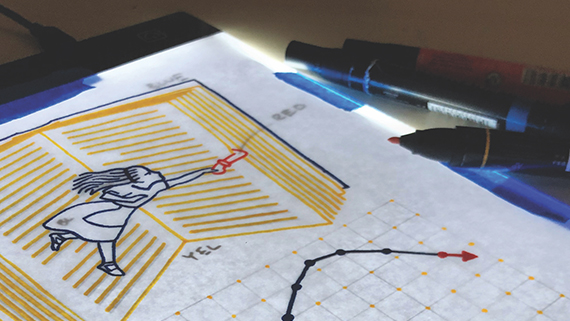
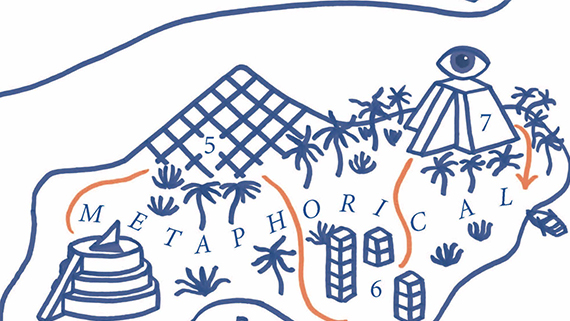
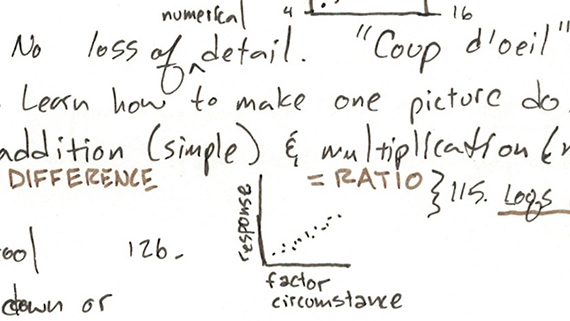
Hand Drawing a Book
Process and logic behind 300 illustrations.
See older essays in the blog archive.

Info We Trust and Visionary Press are DBAs of Information Productions LLC, San Francisco.
Info We Trust ® is a registered service mark. © 2013–2026 RJ Andrews.