Portfolio
Some work is confidential. Below are selected public projects that demonstrate range.
CLICK ANY PROJECT FOR DETAILS
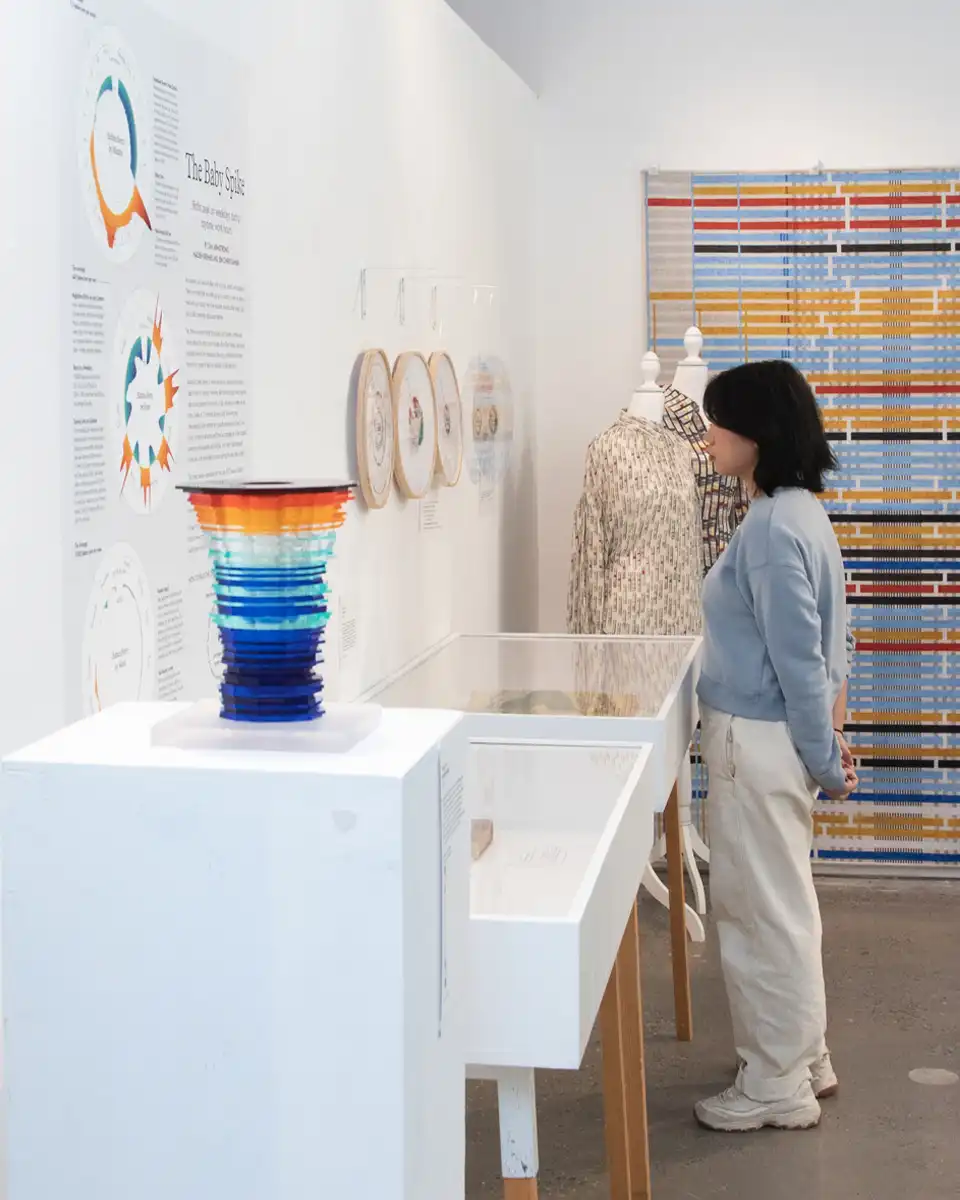
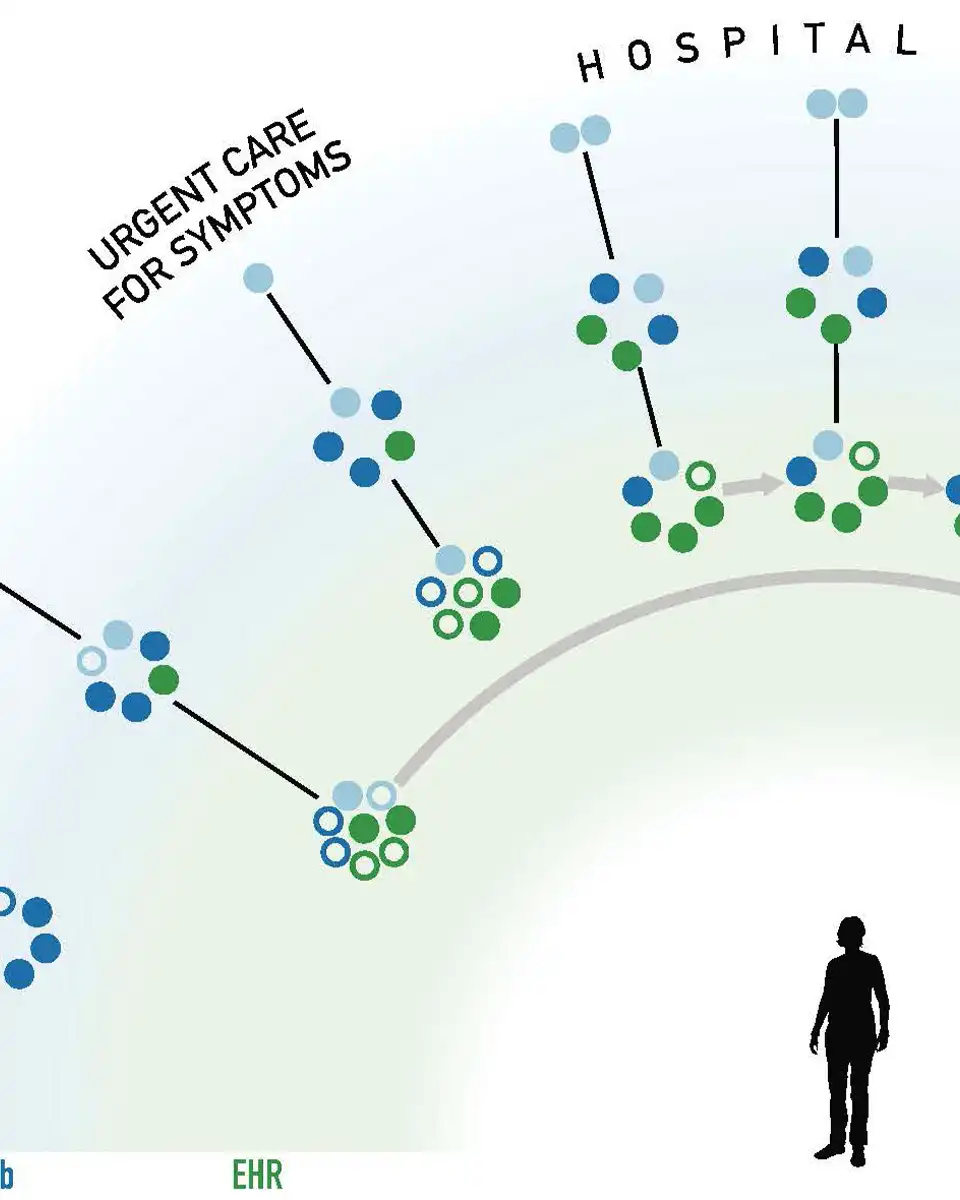
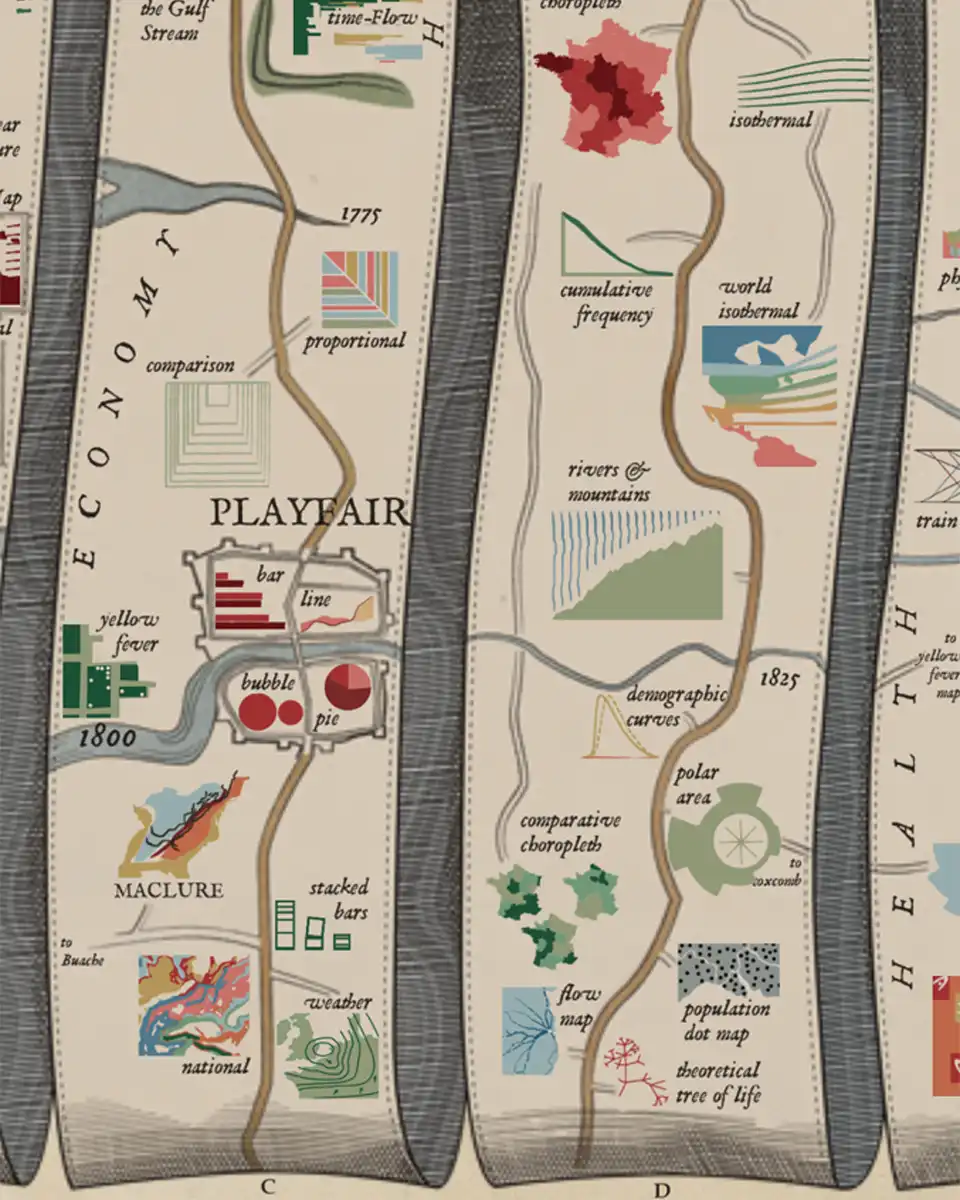
Craft of Data Graphics exhibition
NYC art show of spectacular contemporary and rare works
Craft of Data Graphics exhibition
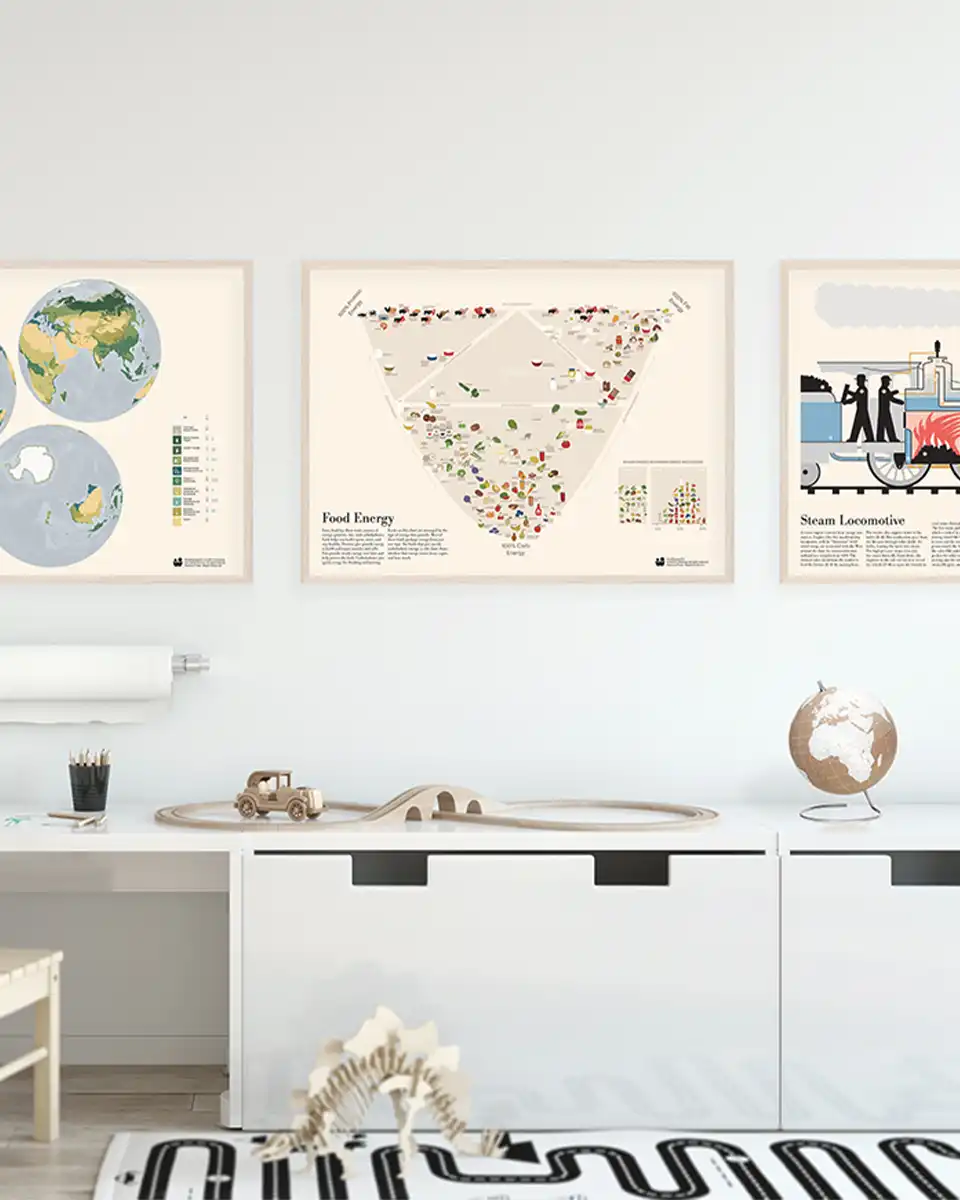
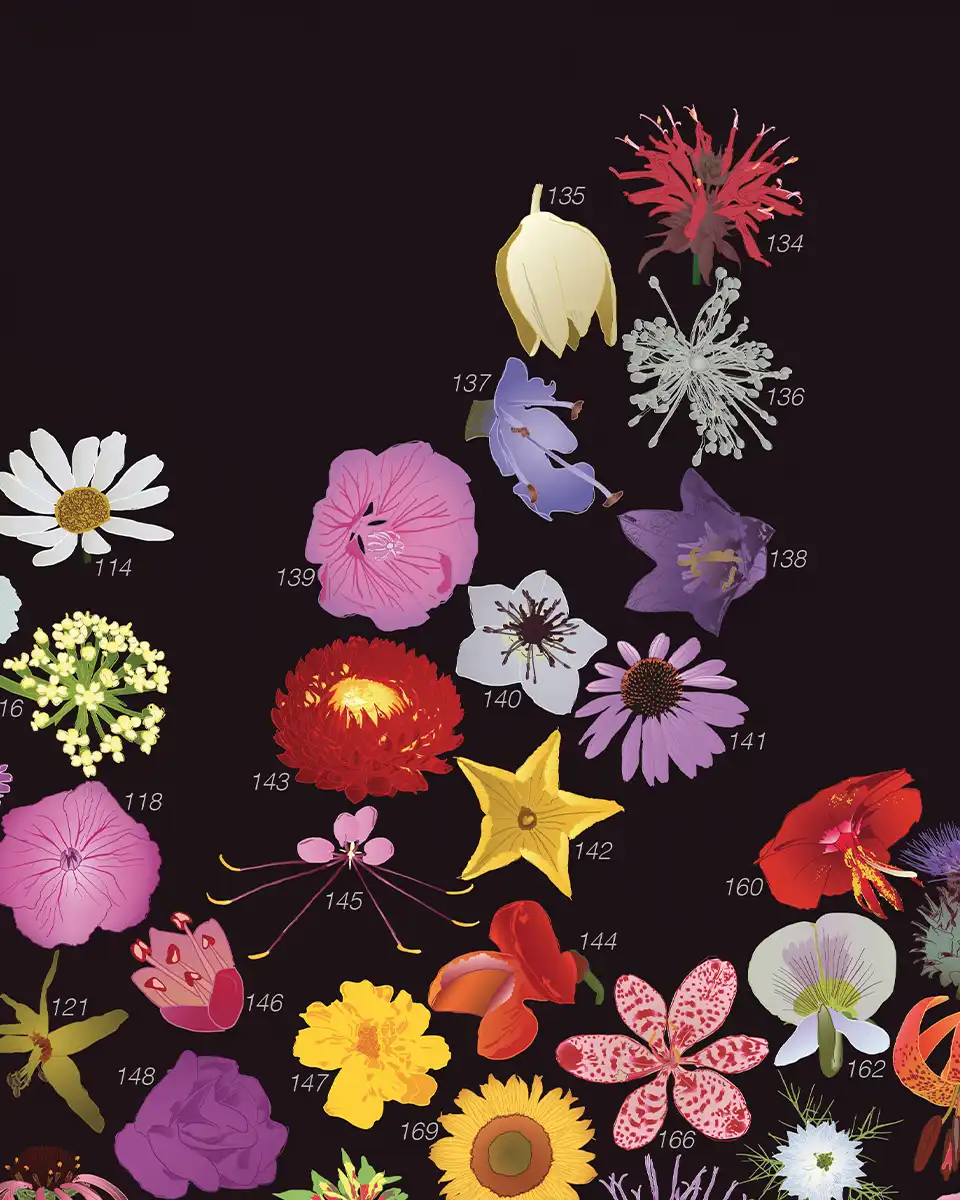
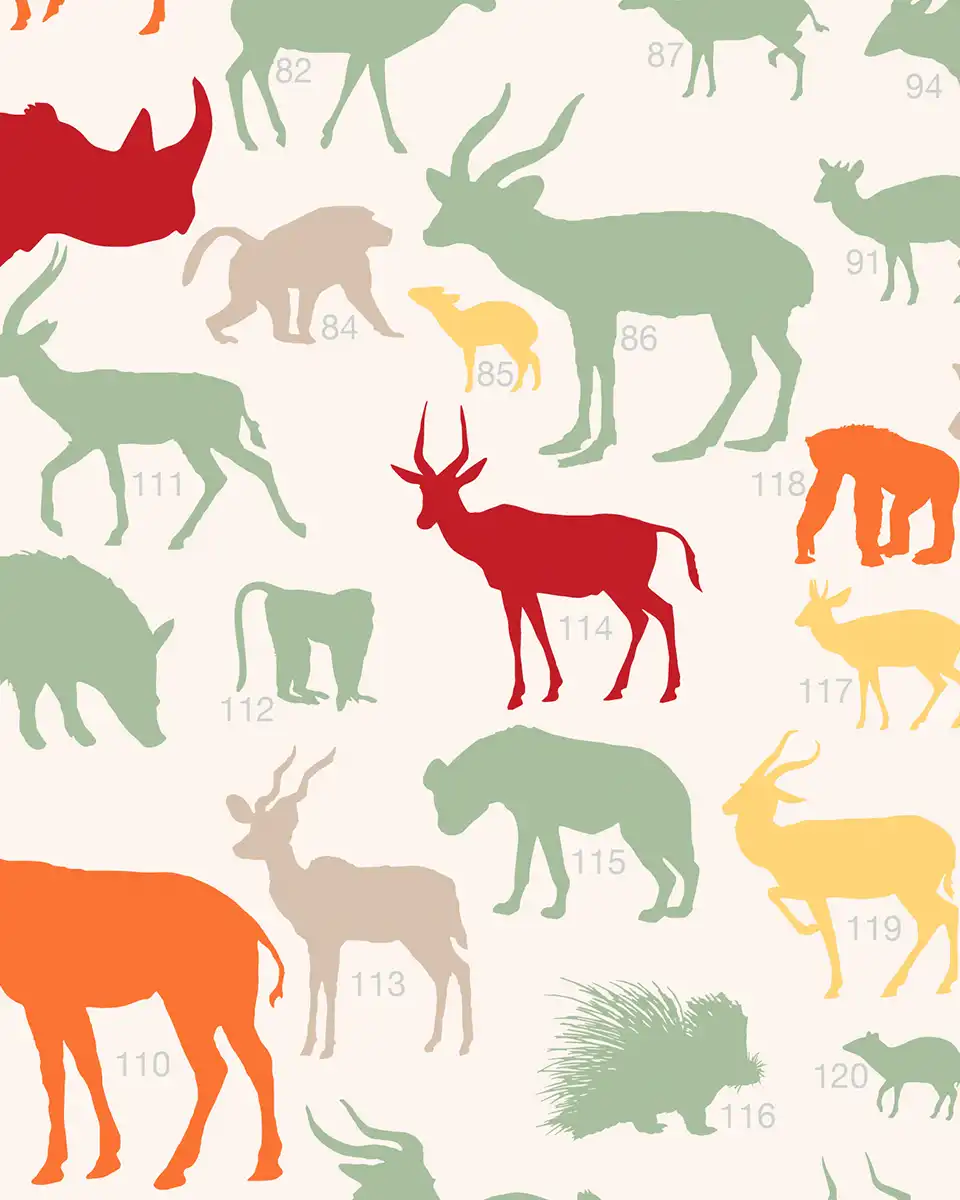
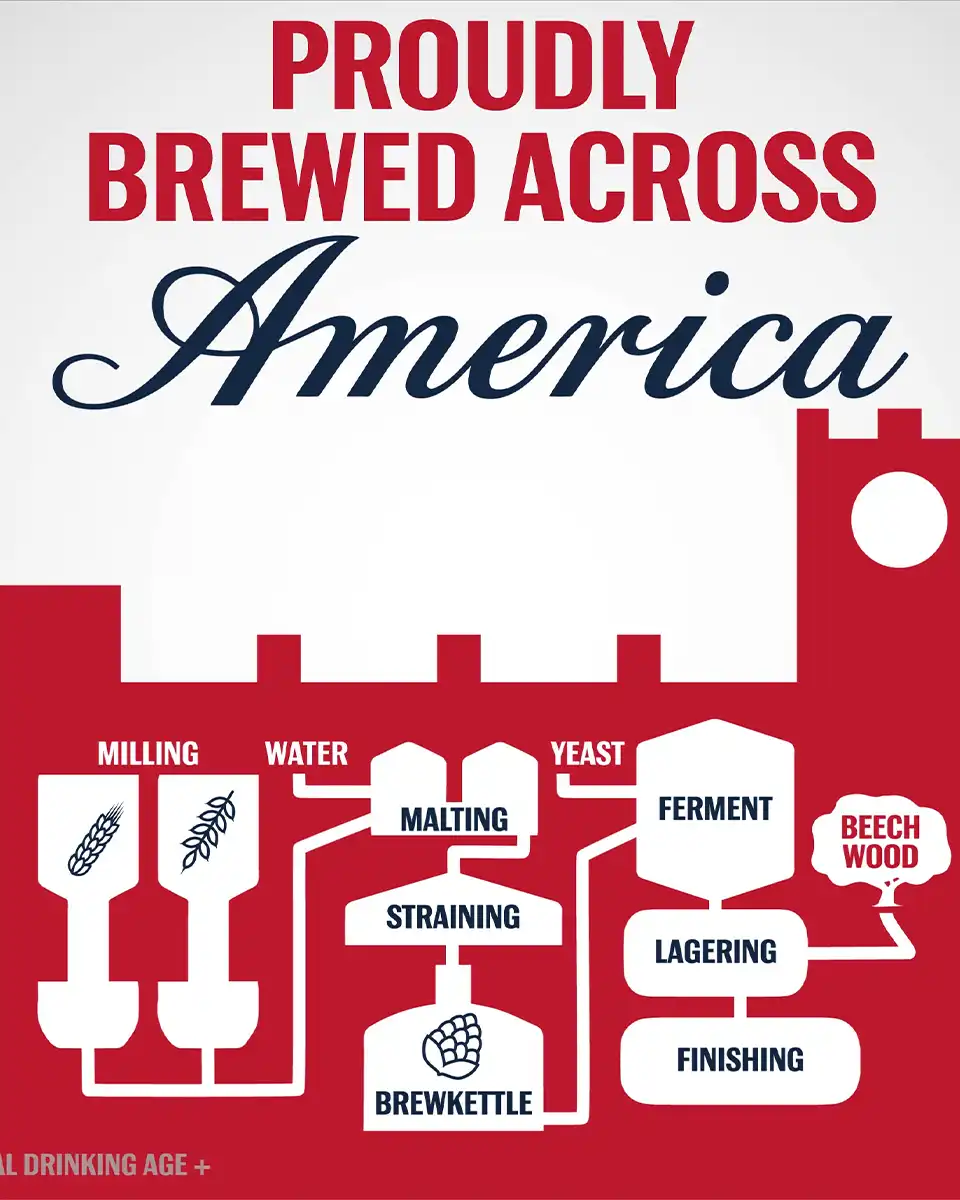
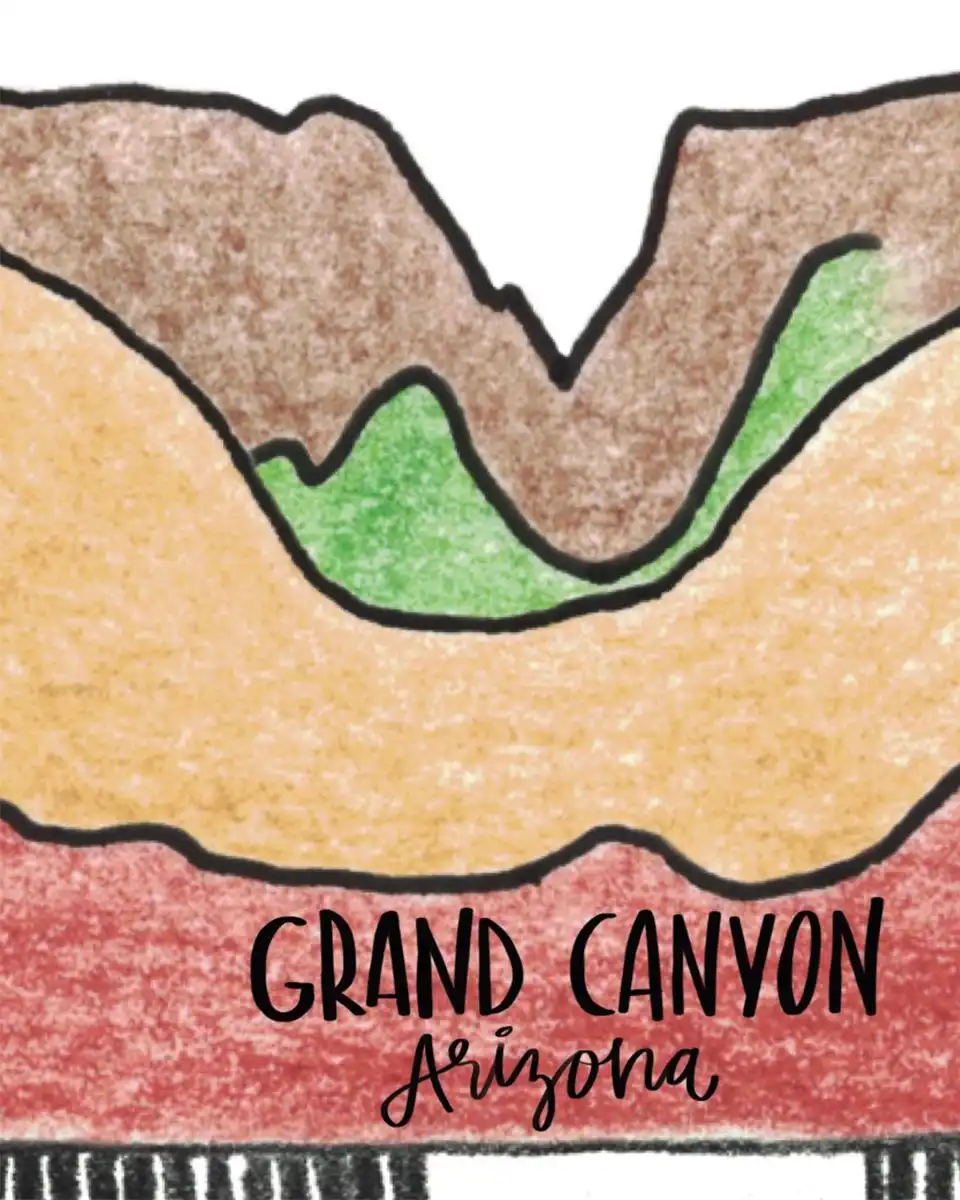
Maps for Kids poster series
Information-graphic posters to read together.
Maps for Kids poster series
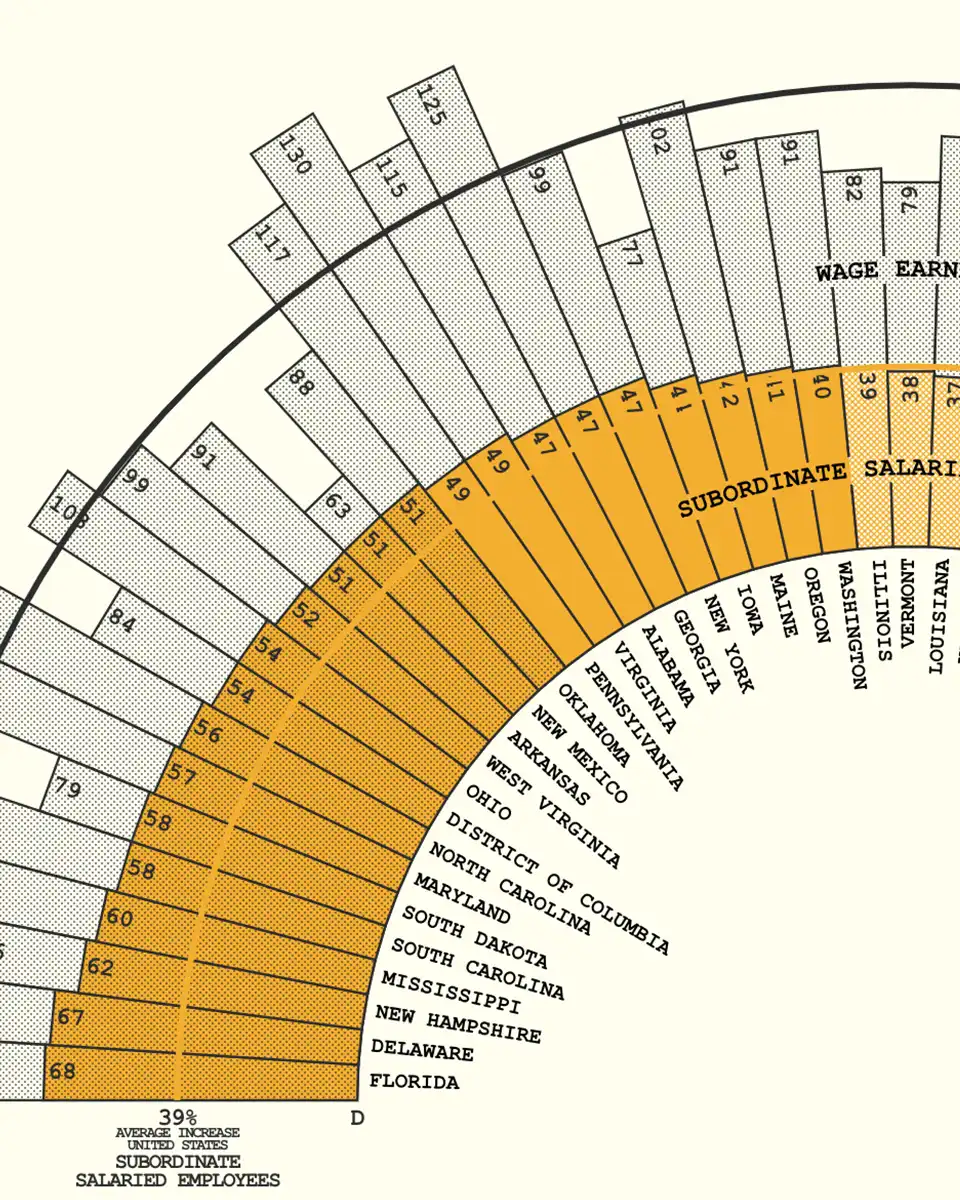
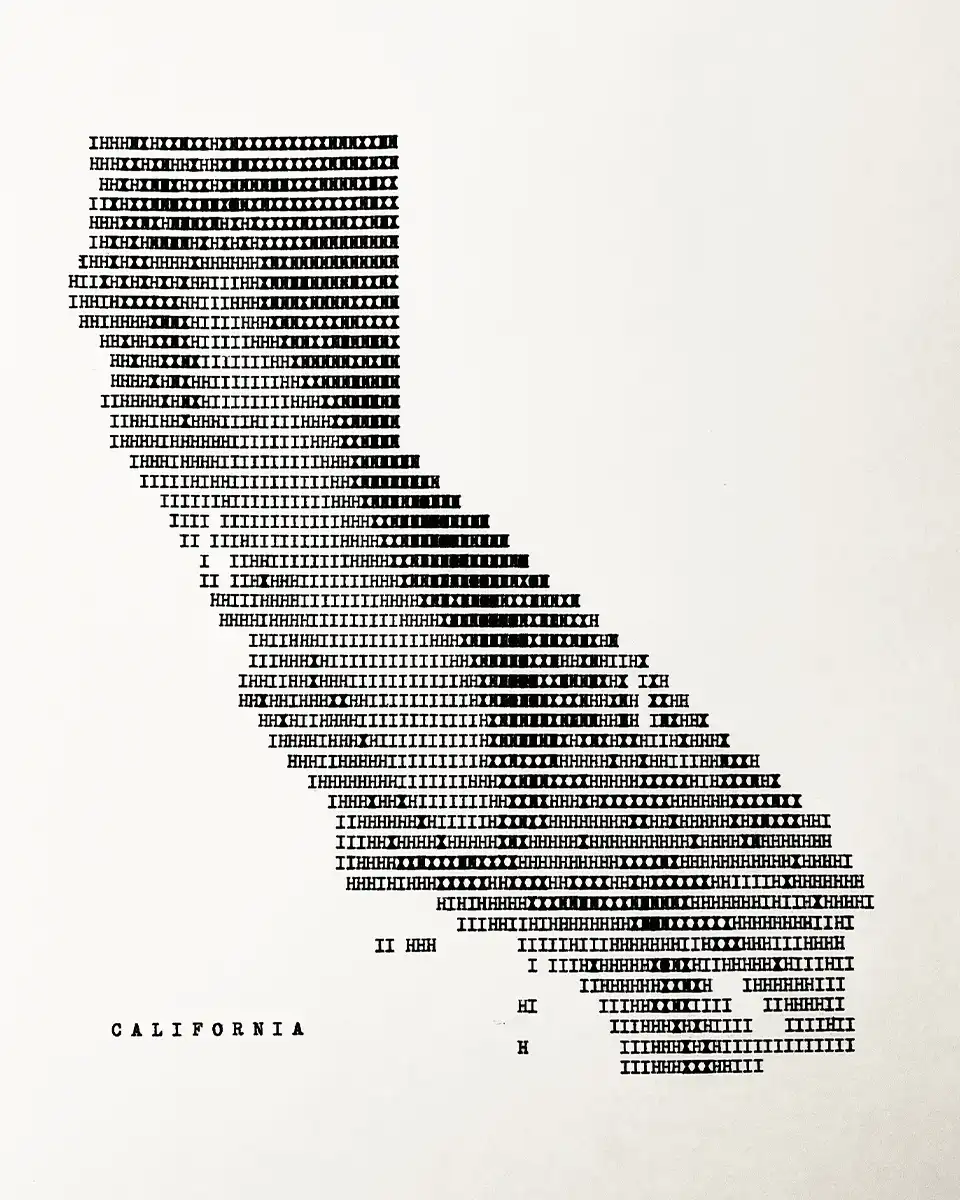
Hand-typed California
Seven-class elevation map created on an antique typewriter.
Hand-typed California
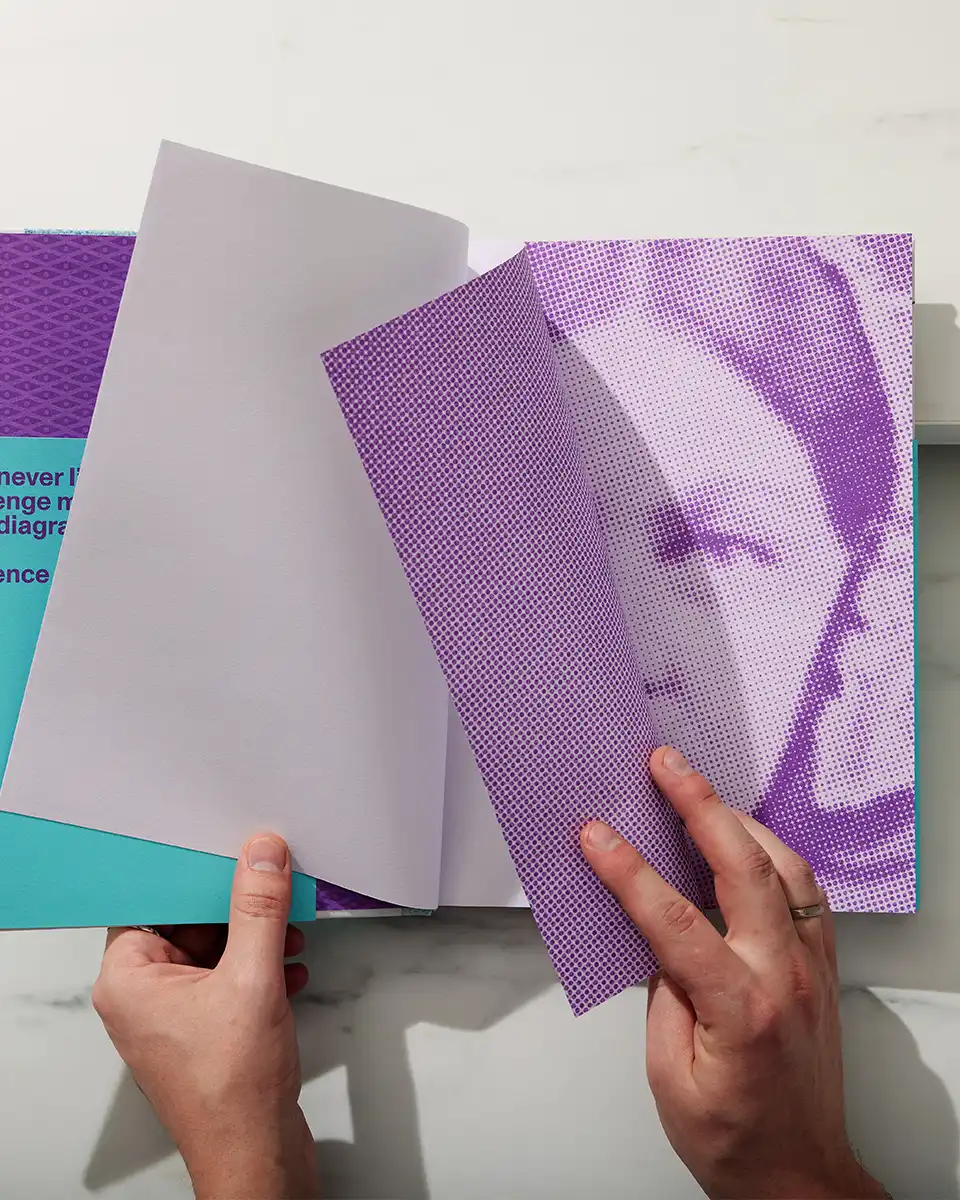
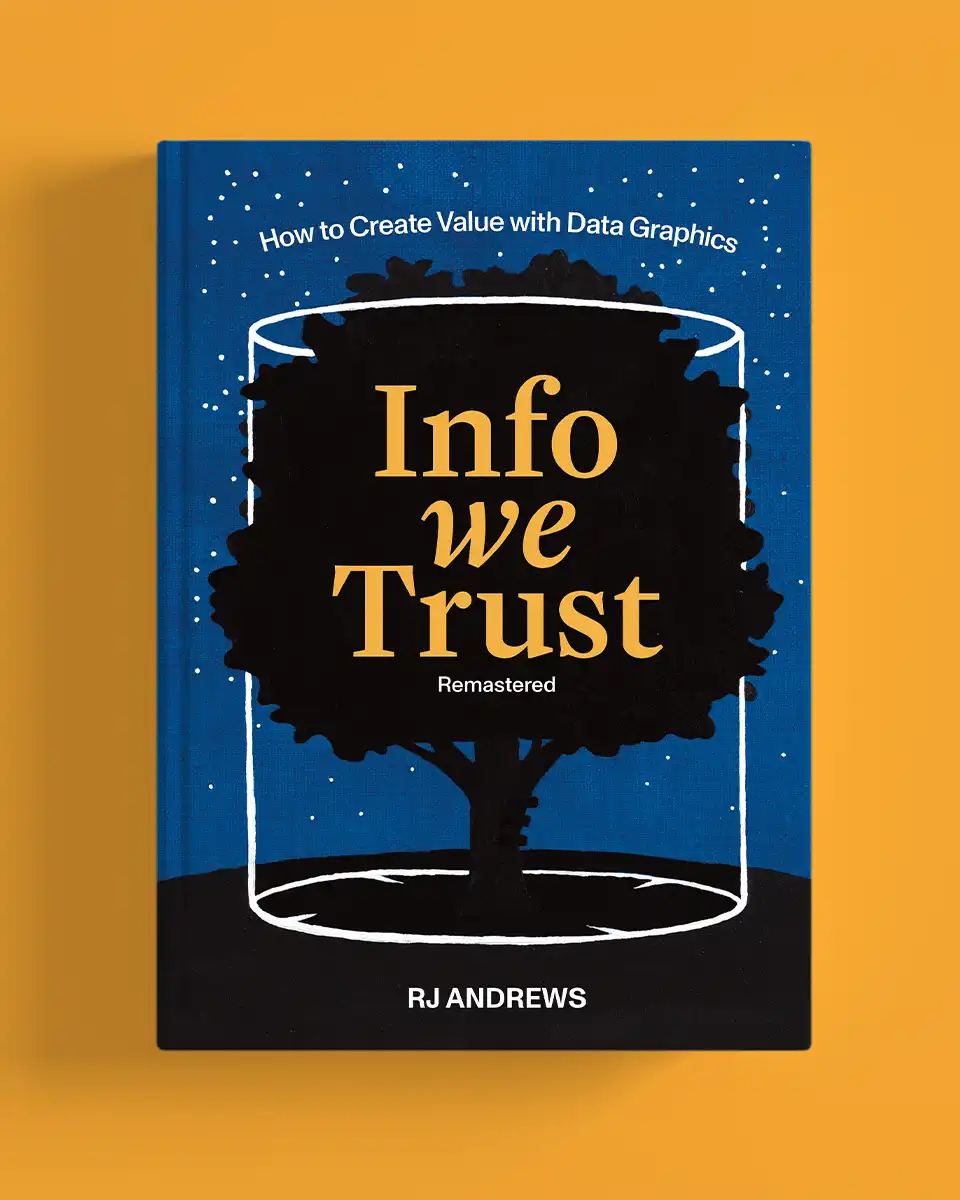
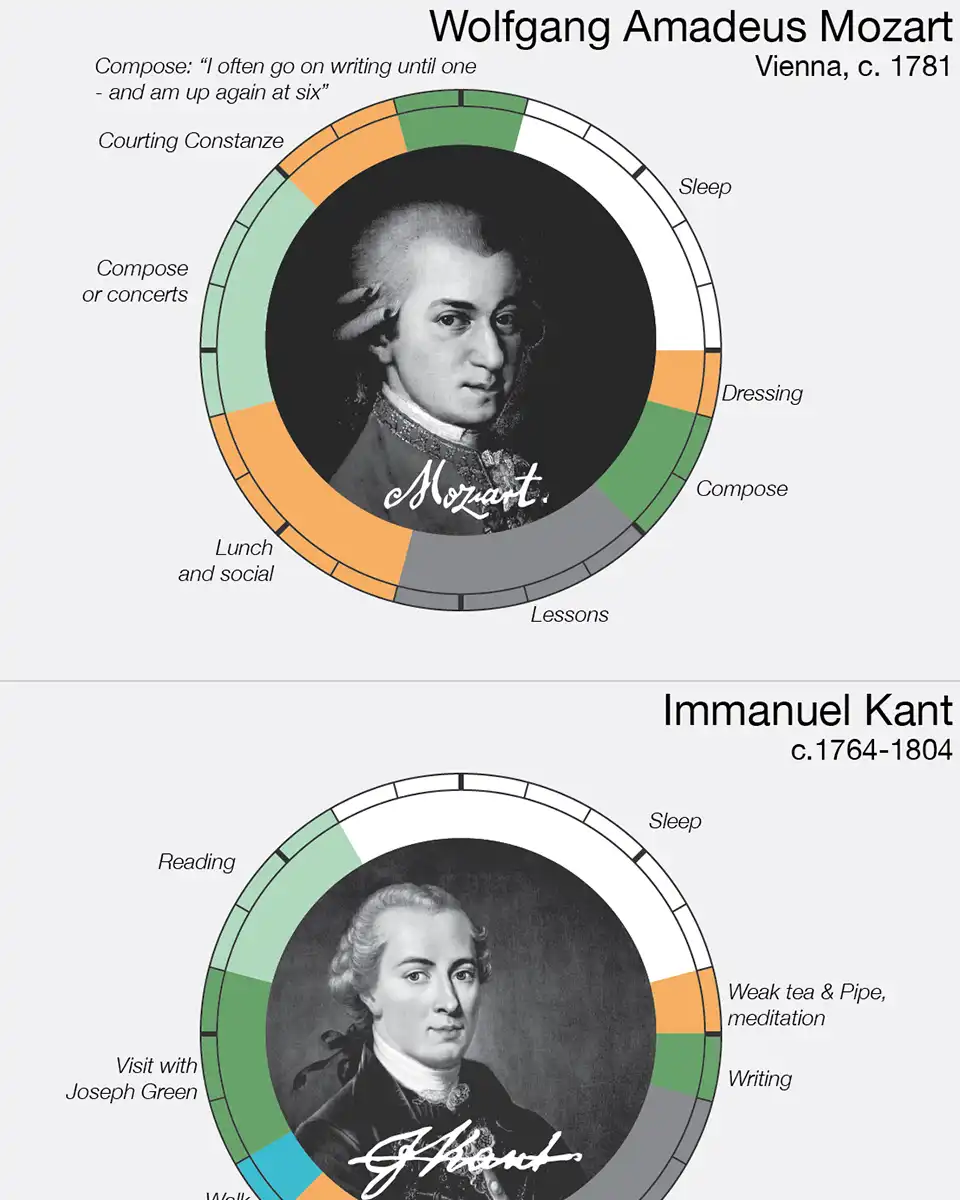
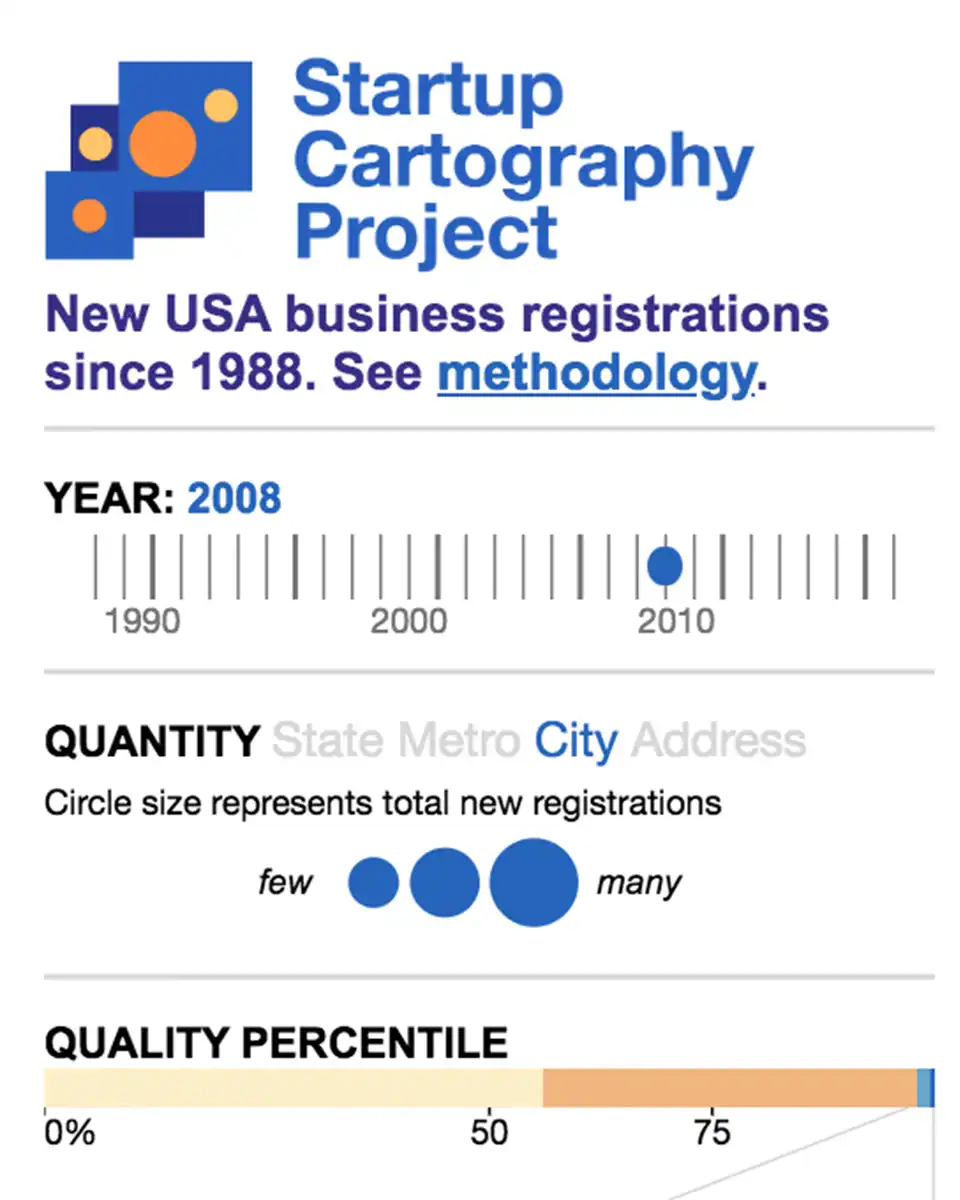
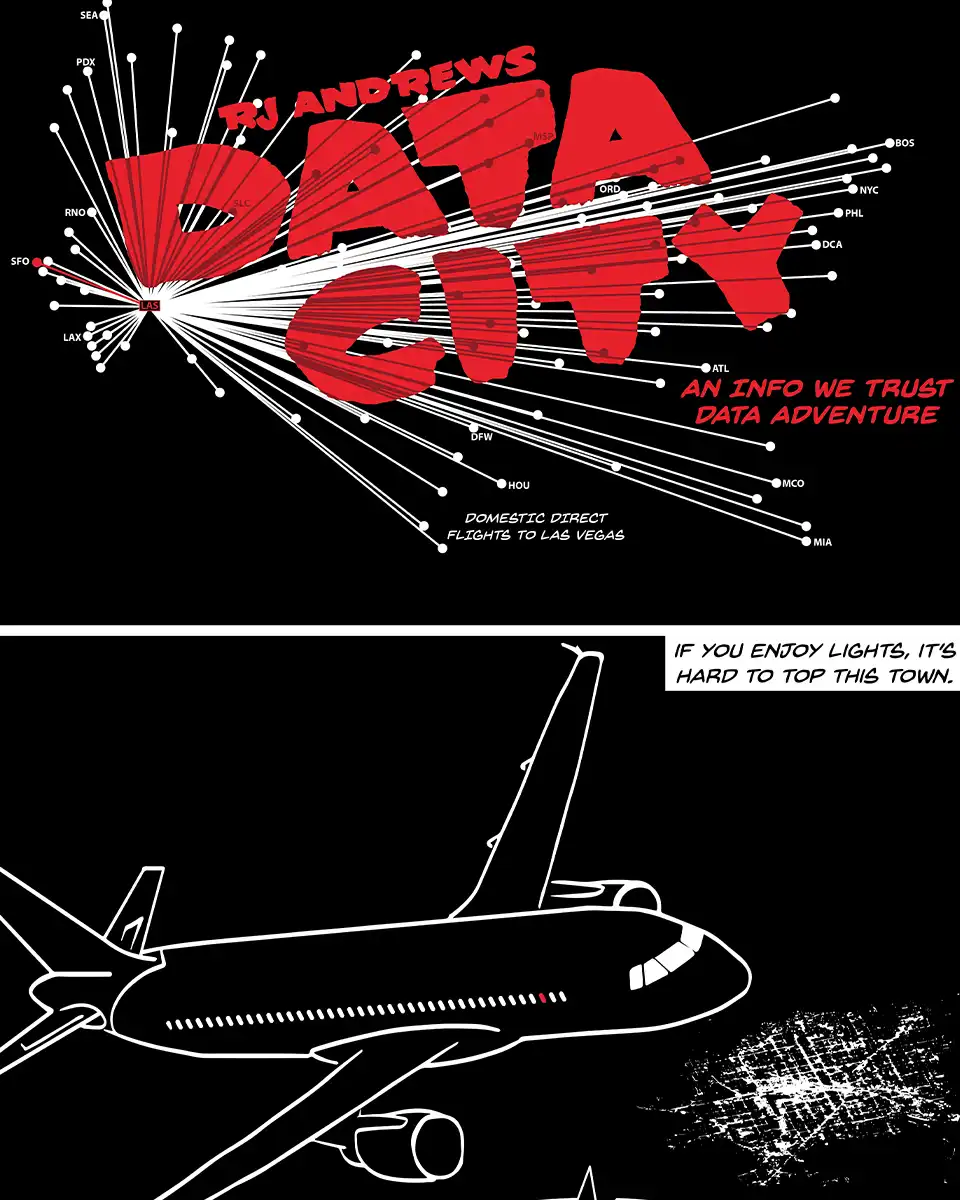
Information Graphic Visionaries
Books celebrating spectacular data visualization creators.
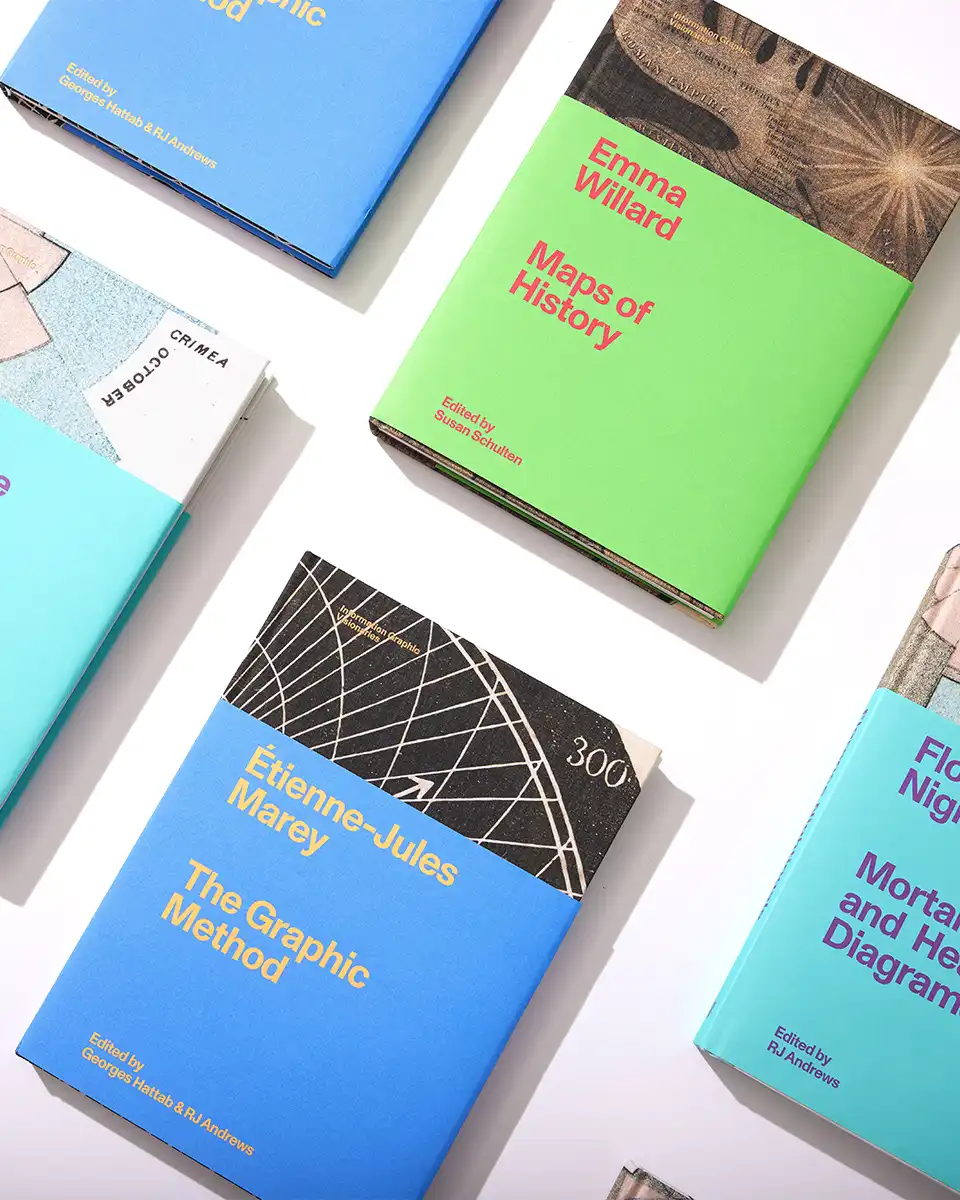
Information Graphic Visionaries
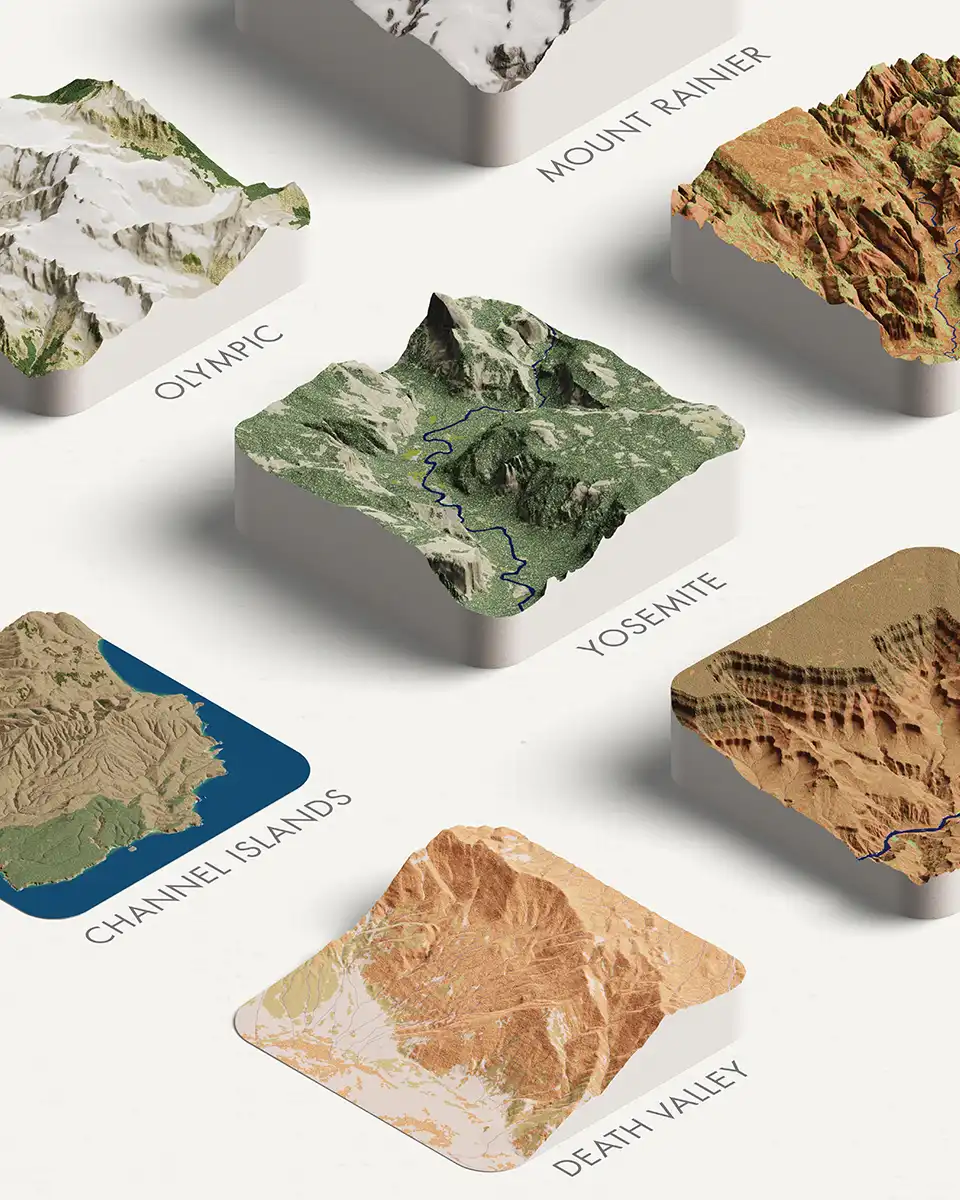
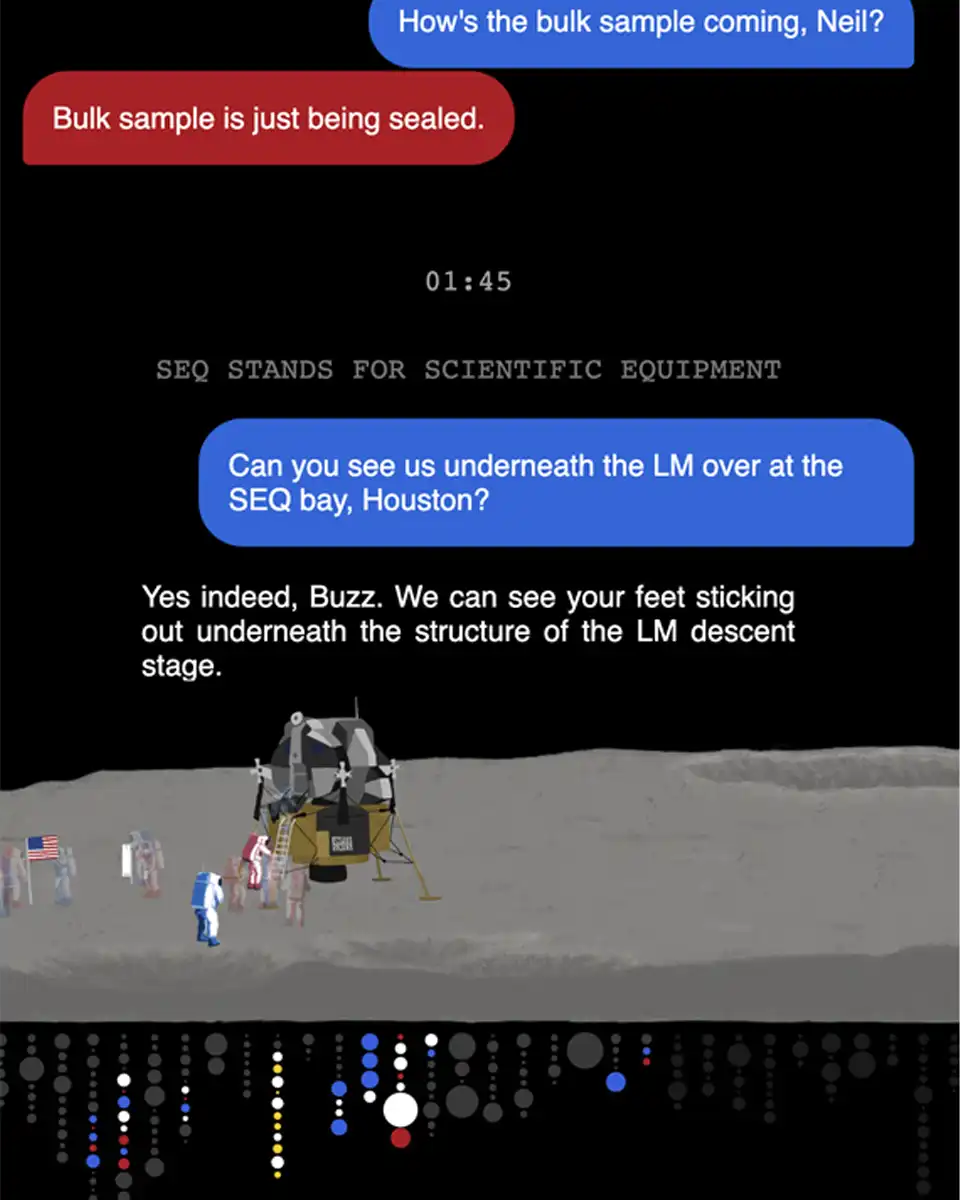
Cross-sections through California
Elevation, land cover, and charts
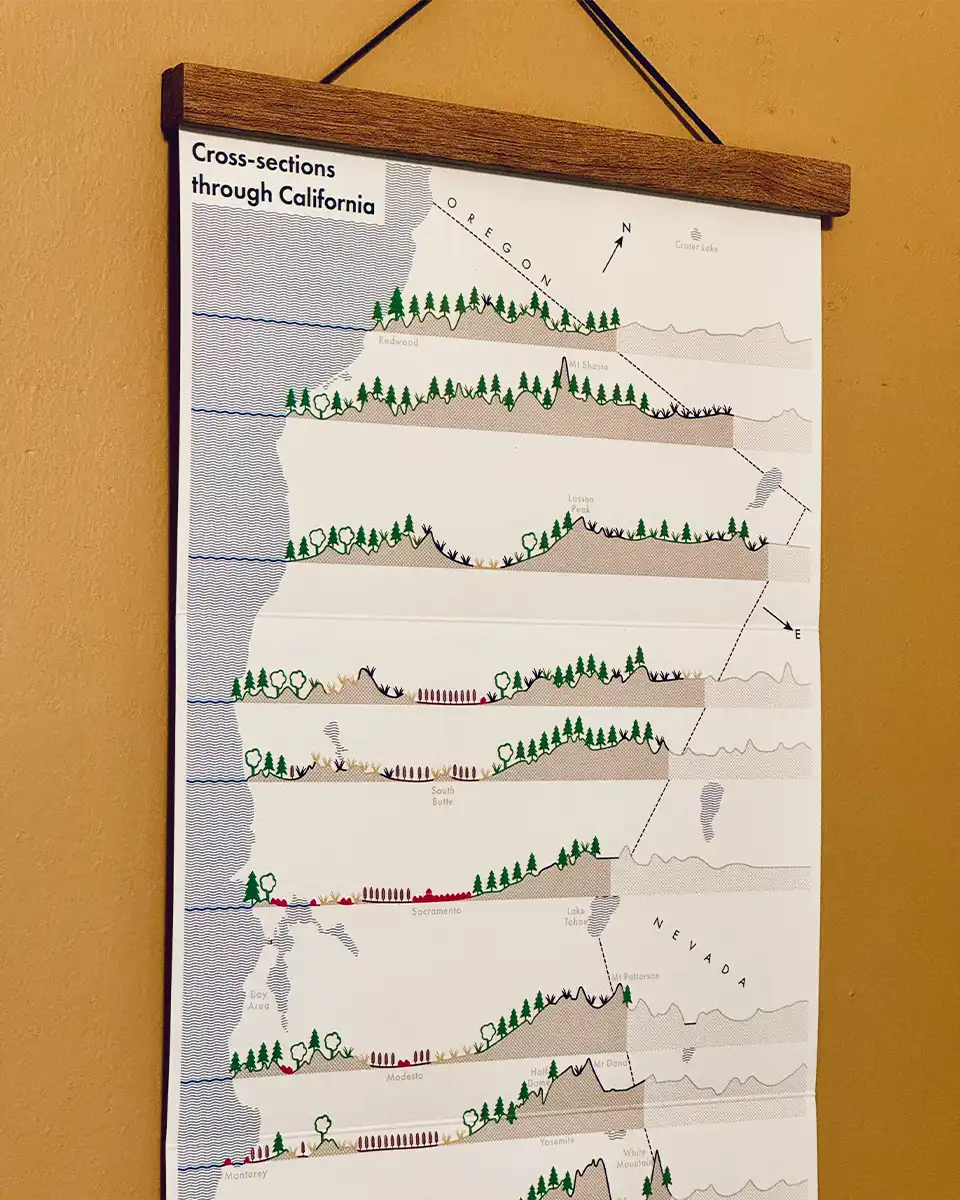
Cross-sections through California
Want to work together?
For workshops, speaking, or consulting, visit the Services page or send a note.

Info We Trust and Visionary Press are DBAs of Information Productions LLC, San Francisco.
Info We Trust ® is a registered service mark. © 2013–2026 RJ Andrews.