About RJ Andrews
Obsessed with data graphics.
I design high-stakes charts, diagrams, and maps—and publish books and prints celebrating the craft and history of data graphics.
My obsession with data graphics began at the MIT Media Lab. I next learned the power of data work in academic medicine before branching out to serve a broad range of clients. In early 2020, I returned to public health by serving daily graphic reports to The White House. My latest book is Info We Trust, Remastered—a "love letter to data storytelling."
My passion is studying the history of information design. It exposes me to new ways to solve information problems. It also grounds my work in a tradition of people all over the world and all over society who worked hard to better discern reality and create shared understanding.
USEFUL LINKS
Out and about
Some engagements are confidential; here are selected organizations where I’ve presented data stories or delivered design work.


Publications collected by
American Philosophical Society, Amherst College, The Book Club of California, Boston Public Library, University of Colorado Boulder, David Rumsey Map Collection, University of Denver, Durham University, Florence Nightingale Museum, Free University of Berlin, University of Illinois Urbana-Champaign, University of Lethbridge, Letterform Archive, Library Company of Philadelphia, London College of Communication, MIT, Michigan State University, Middlebury College, Newberry Library, North Carolina State University, Norwegian University of Science and Technology (NTNU), University of Oregon, Phillips Academy (Andover), Pixar University, Princeton University, Quentin Blake Centre for Illustration, University of Southern Maine, Skidmore College, Stanford University, Tokyo Keizai University, University of Toronto, UCLA Library, U.S. Library of Congress, Utrecht University Library, Wichita State University, University of Wisconsin–Milwaukee, Zentralbibliothek Zürich.
Media coverage
American Statistical Association, BBC, Bloomberg, Colossal, Fast Company, It's Nice That, Le Monde, National Geographic, Royal Statistical Society, Scientific American
Andrews Collection of Information Graphics
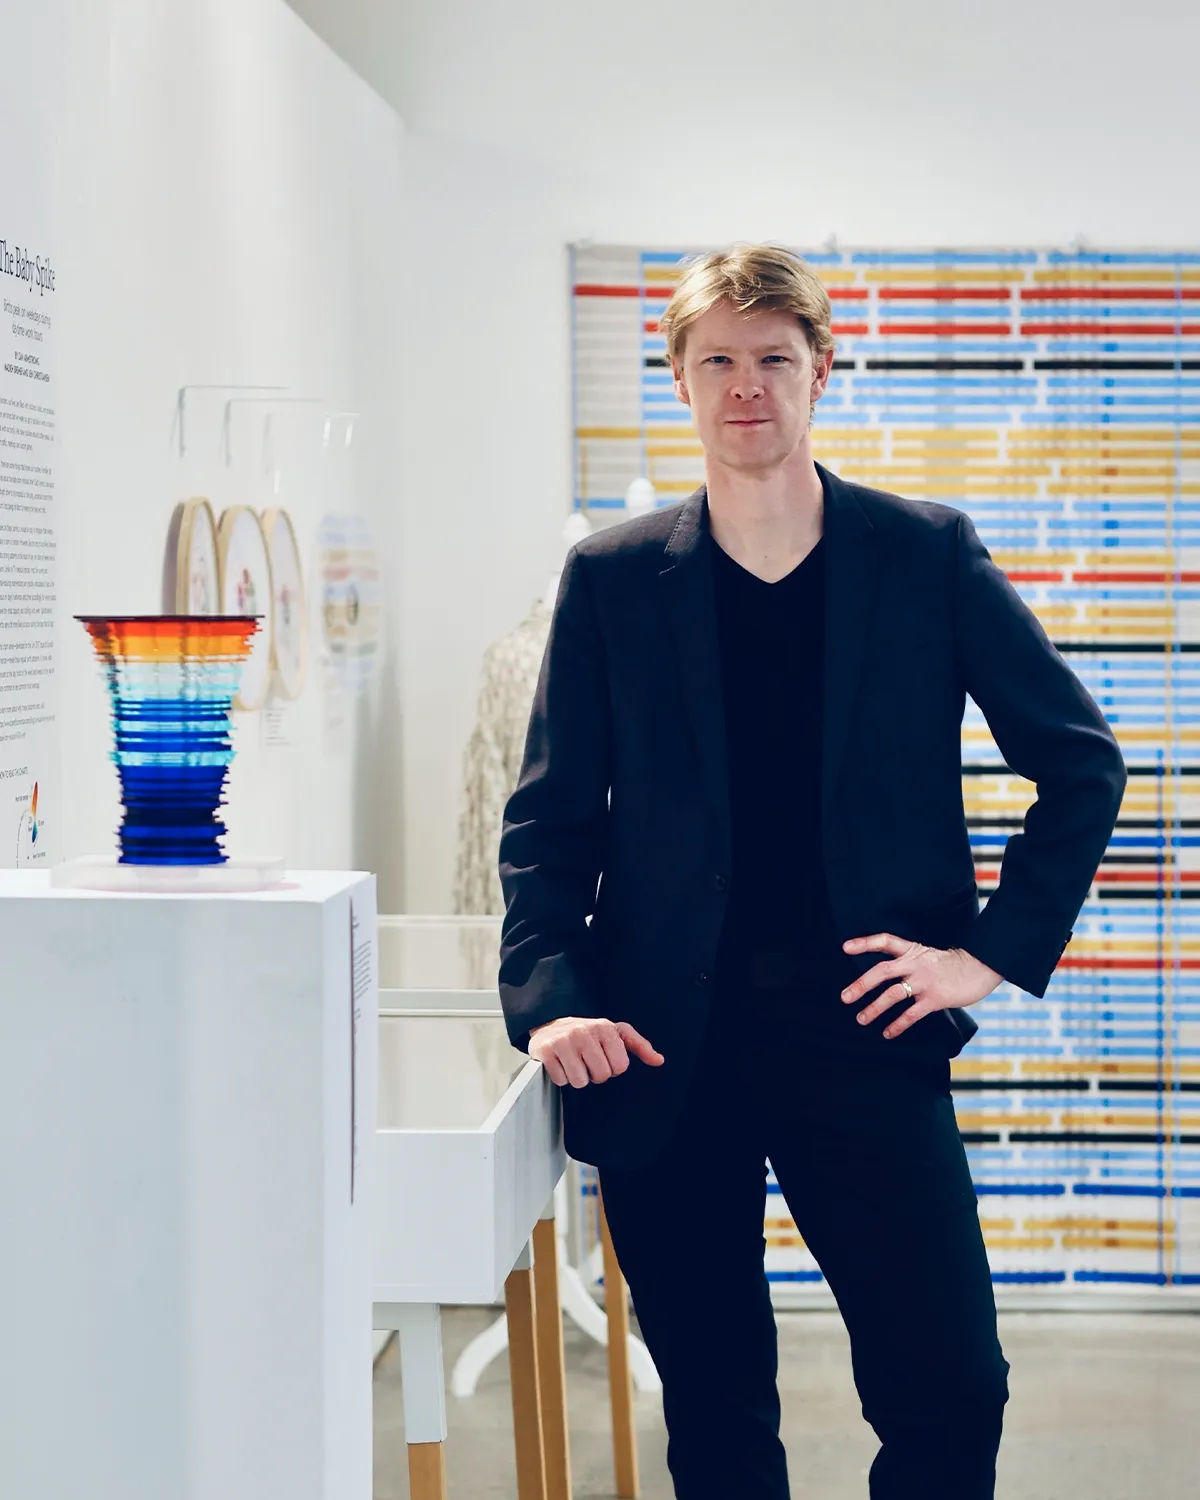
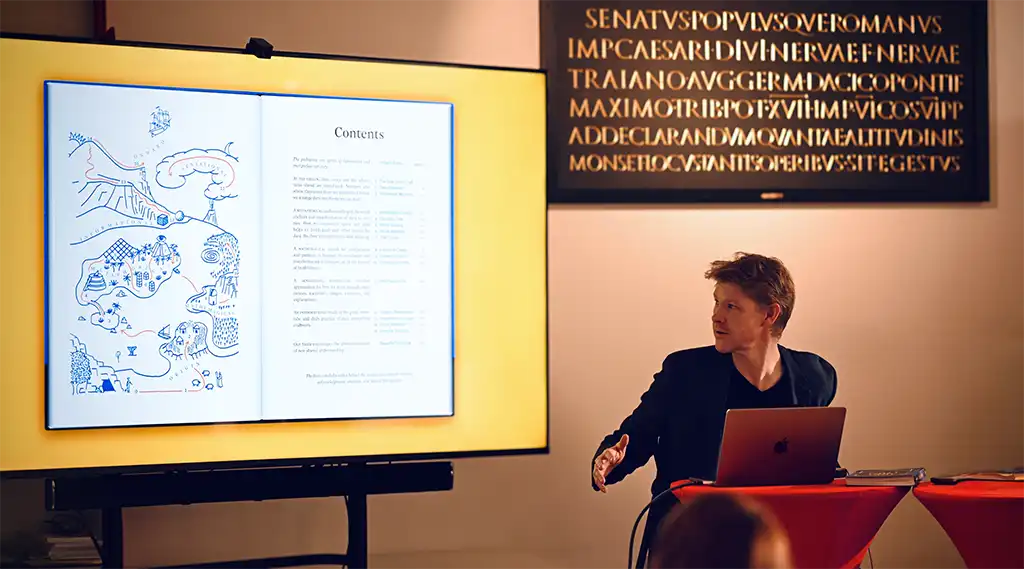
I host tours of the Andrews Collection of Information Graphics in San Francisco—a working library of rare charts, maps, atlases, and diagrams. Some objects are beautiful examples of craft; others are historically important because they changed how people measured and explained the world.
The collection features many famous designers, including William Playfair, Florence Nightingale, and Charles Joseph Minard. It also contains many important milestones, including the first shaded table, supply-and-demand curves, and Venn diagrams. I have growing sets of statistical atlases and Isotype Institute publications.
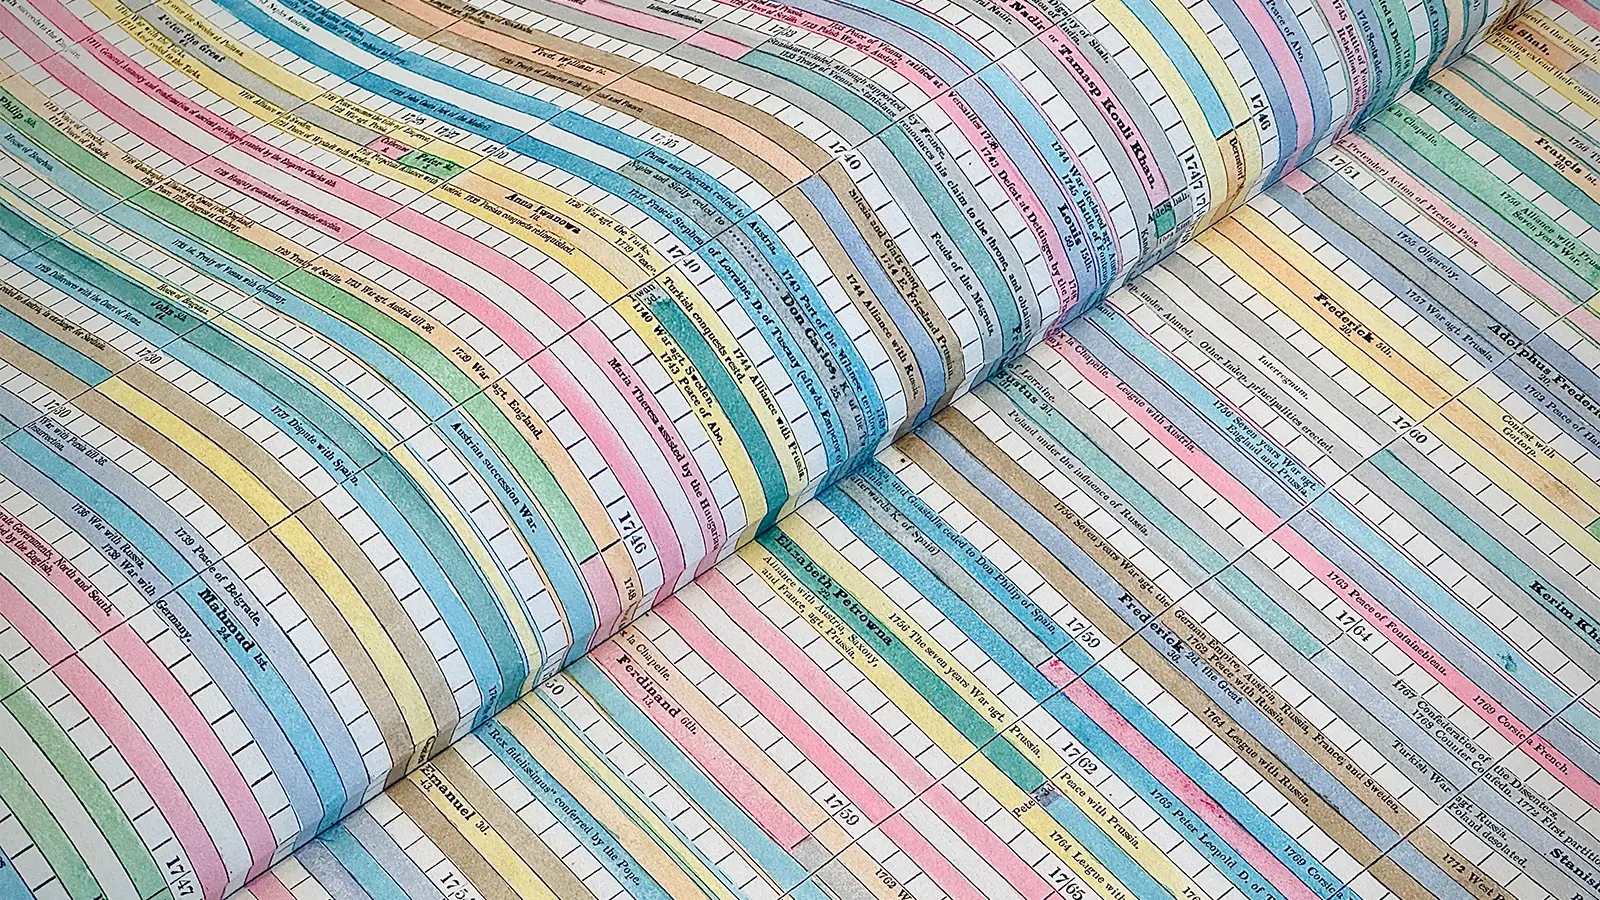
An Embellished Chart of General History and Chronology, Frances Harriet Lightfoot (London, 1831)
My collection is my design library. I study these artifacts to learn composition, emphasis, visual metaphor, and narrative annotation. This practice feeds directly into my professional work: helping teams communicate complex situations clearly, honestly, and with enough nuance to support real decisions.
These rare charts bring me great joy and I am delighted to share my enthusiasm for these graphic wonders through teaching and by hosting visitors to my studio library.
RJ Andrews Curriculum Vitae
DATA STORYTELLING
2026 "Isotype Explorer" interactive archive
2026 USA Population by Age (1900–2025) stereogram
2025 "Maps for Kids" inaugural poster trio
2024 "Delicious Parks" with Wendy Shijia Wang
2020 "Cloud Zoo" illustrated interactive with Amber Thomas for The Pudding
2020 Covid-19 information graphics for U.S. Food and Drug Administration
2020 Covid-19 interactive for Stanford University et al.
2020 "Cross-sections through California" foldout print
2019 "Neil and Buzz Go For a Walk" Apollo 11 interactive
2019 Startup Cartography Project interactive map of American entrepreneurship
2017 "Proudly Brewed Across America" looping infographics for Budweiser
2017 "Map of Firsts" interactive timeline of iconic data graphics
2016 Information graphics presented to The White House OSTP
2016 "Profling the Parks" short film about U.S. National Park System
2015 "Data City" comic about Las Vegas
2015 "Board Member Overlap" infographic about interlocking directorates
2015 "Endangered Safari" threatened species interactive
2015 "Bloom" looping information graphic
2014 "Creative Routines"
2013 USS Constitution synoptic chart triptych
BOOKS
2025 Info We Trust: How to Create Value with Data Graphics (Visionary Press)
2022 Florence Nightingale: Mortality and Health Diagrams (Visionary Press)
2022 Étienne-Jules Marey: The Graphic Method with Georges Hattab (Visionary Press)
2019 Info We Trust: How to Inspire the World with Data (Wiley)
RESEARCH PAPERS, EXHIBITIONS, TEACHING
2026 Guest Instructor, Stanford University d.school
2025 "Info We Trust: The Craft of Data Graphics" NYC exhibition
2025 "Principles of Data Graphics" Cooper Union public workshop
2024 "Meaningful Science Graphics" CCC at UCSF Mission Bay
2024 "Persuasive Data Graphics" Letterform Archive public workshop
2024 "Principles of Data Graphics" Cooper Union public workshop
2022 "Florence Nightingale's Data Revolution" for Scientific American
2021 "The Radiant Diagrams of Florence Nightingale" with Michael Friendly, SORT
2020 "God's Revenge Upon Murder" Significance Magazine
2020 "Data Visualization and the Modern Imagination" exhibition curator, Stanford University
2020 Contributions to "The Startup Cartography Project: Measuring and Mapping Entrepreneurial Ecosystems"
2019 "Data Shadows" Signficance Magazine
2019 "Florence Nightingale is a Design Hero" Journal of the Data Visualization Society
2017 "Picturing the Great Migration" Significance Magazine with Howard Wainer
2017 Work selected for 21st Century Communication by National Gegraphic Learning
2017 Work selected for Data Visualization For Success, a Chinese-English bilingual by book (Images)
2015 Graphics for "Where is Silicon Valley?" by Jorge Guzman and Scott Stern published in Science
2014 Work selected for Infographics Design, a Japanese-English bilingual book (BNN)
JURIES AND AWARDS
2025 Steering Committee, Ruderman Conference on Cartography, Stanford
2024 "Delicious Parks" selected for NACIS Atlas of Design
2024 Am. Statistical Assoc. Symposium on Data Science & Statistics, Referee
2020 "Cross-sections through California" selected for NACIS Atlas of Design
2019 Jury at MIT Research Slam @Stanford
2019 Jury at World Bank VizRisk Challenge
2018 Jury at IEEE PacficVis Data Storytelling Contest
2017 "Map of Firsts" Information is Beautiful Awards Shortlist
2016 "Are Gazelles Endangered?" awarded AAAS Data Storytelling Professional Winner
2014 Creative Routines Information is Beautiful Awards Gold Infographic award
TALKS
2026 "Data-Graphic Masterpieces" ABAA California Antiquarian Book Fair
2026 "God’s Revenge Upon Murder" Florence Nightingale Museum
2025 "Data Storytelling Insights & Delights" Pratt Institute
2025 "The Art of Data Storytelling" Pixar
2025 "Informaton-Graphic Masterpieces" Book Club of California
2024 "Compared to what?" U.S. Census Bureau
2023 "Circular Delights" Ruderman Conference on Cartography, Stanford
2021 "Florence Nightingale is a Data Storytelling Hero" FWD50 conference
2021 "How to Plug the Big Hole in Digital Viz" Information+ conference
2021 "In conversation with RJ Andrews" Ditchley Foundation
2021 "Florence Nightingale is a Design Hero" Outlier
2020 "The Bar Chart: Official Rules and Regulations" S-H-O-W, Netherlands
2020 "Info We Trust: How to Inspire the World" at David Rumsey Map Center, Stanford
2019 "Making Info We Trust" at IEEE VisInPractice conference in Vancouver, BC
2019 "How data viz sees cartography" at NACIS in Tacoma, Washington
2019 Info We Trust book tour: Airbnb, Facebook, Smithsonian Institute, Spotify, etc.
2015 "Heroes of Interpolation" Tapestry data storytelling conference
INVITED MEMBERSHIPS (PAST & CURRENT)
American Statistical Association
The Book Club of California
Les Chevaliers des Albums de Statistique Graphique
Letterform Archive
Royal Statistical Society
EDUCATION
Master of Business Administration, Massachusetts Institute of Technology
Master of Science in Mechanical Engineering, Northeastern University
Bachelor of Science in Mechanical Engineering, Northeastern University

Info We Trust and Visionary Press are DBAs of Information Productions LLC, San Francisco.
Info We Trust ® is a registered service mark. © 2013–2026 RJ Andrews.