NEW BOOK!
"A love letter to data storytelling."
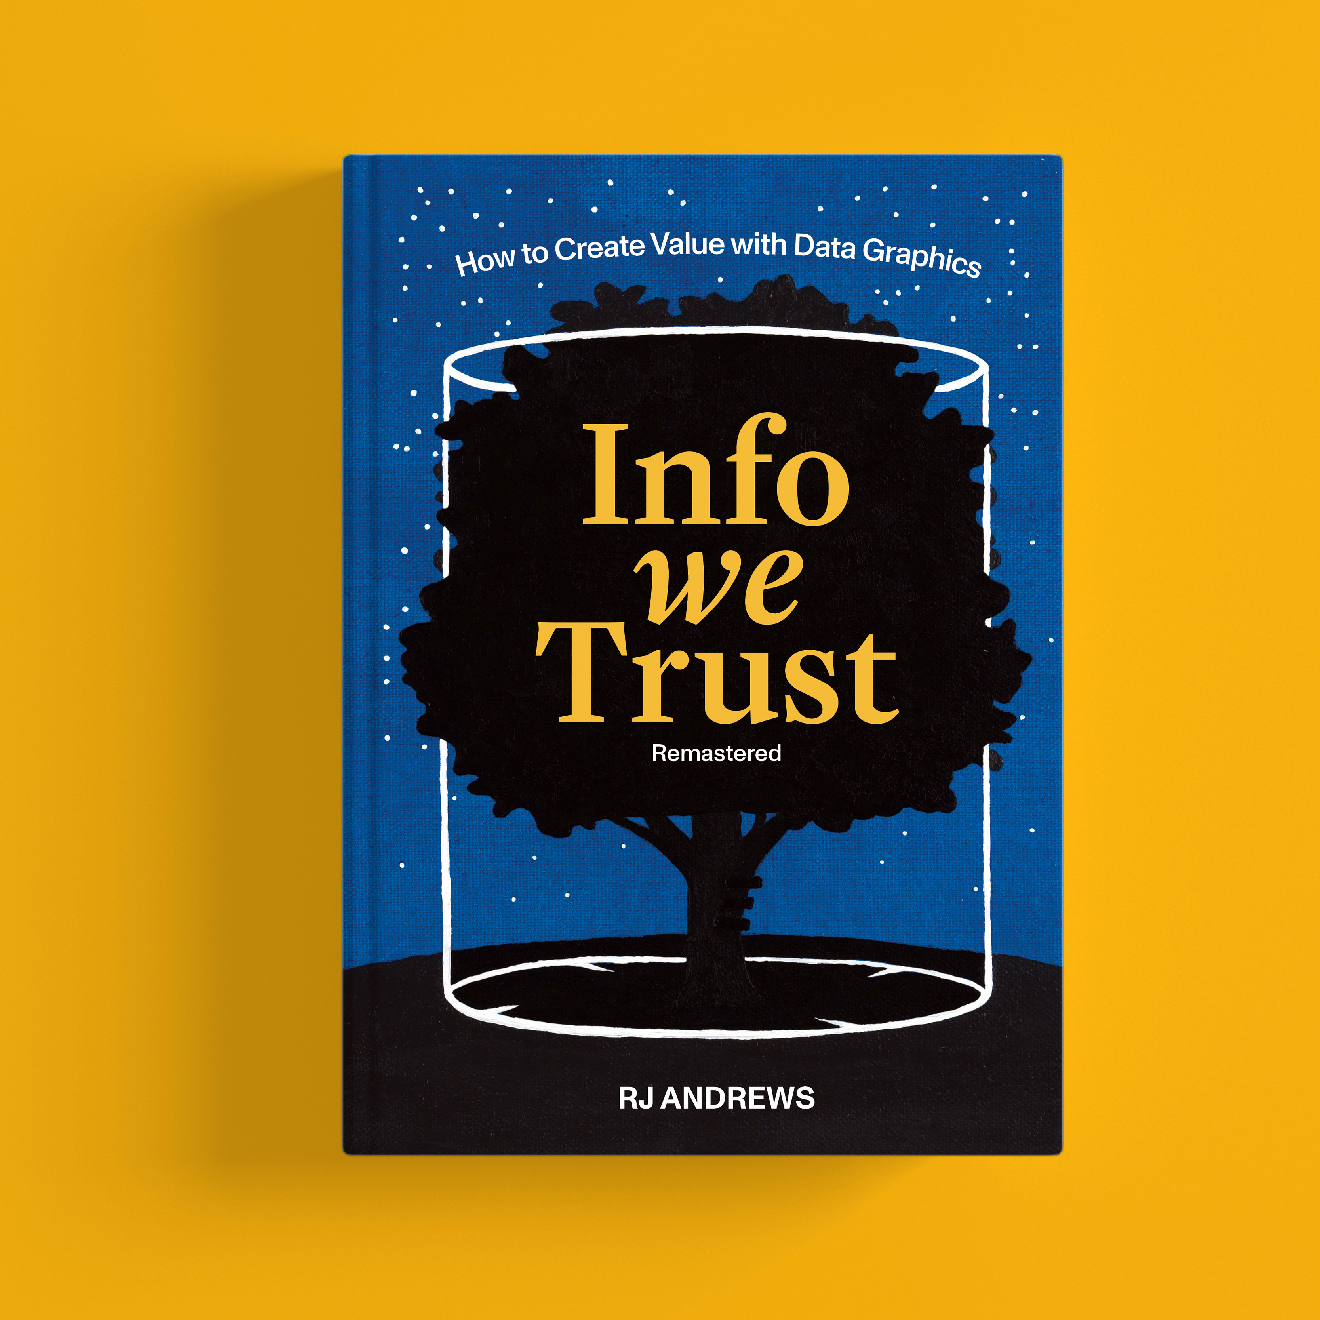
Info We Trust Remastered is coming soon. Reserve your limited edition hardcover today:
Each chapter unveils a rich tapestry of insights, tracing the evolution of charts from mere shadows of civilization to potent instruments of persuasion. Learn more about this new book on its project page.
You don't have a data problem...
you're failing to communicate your data.
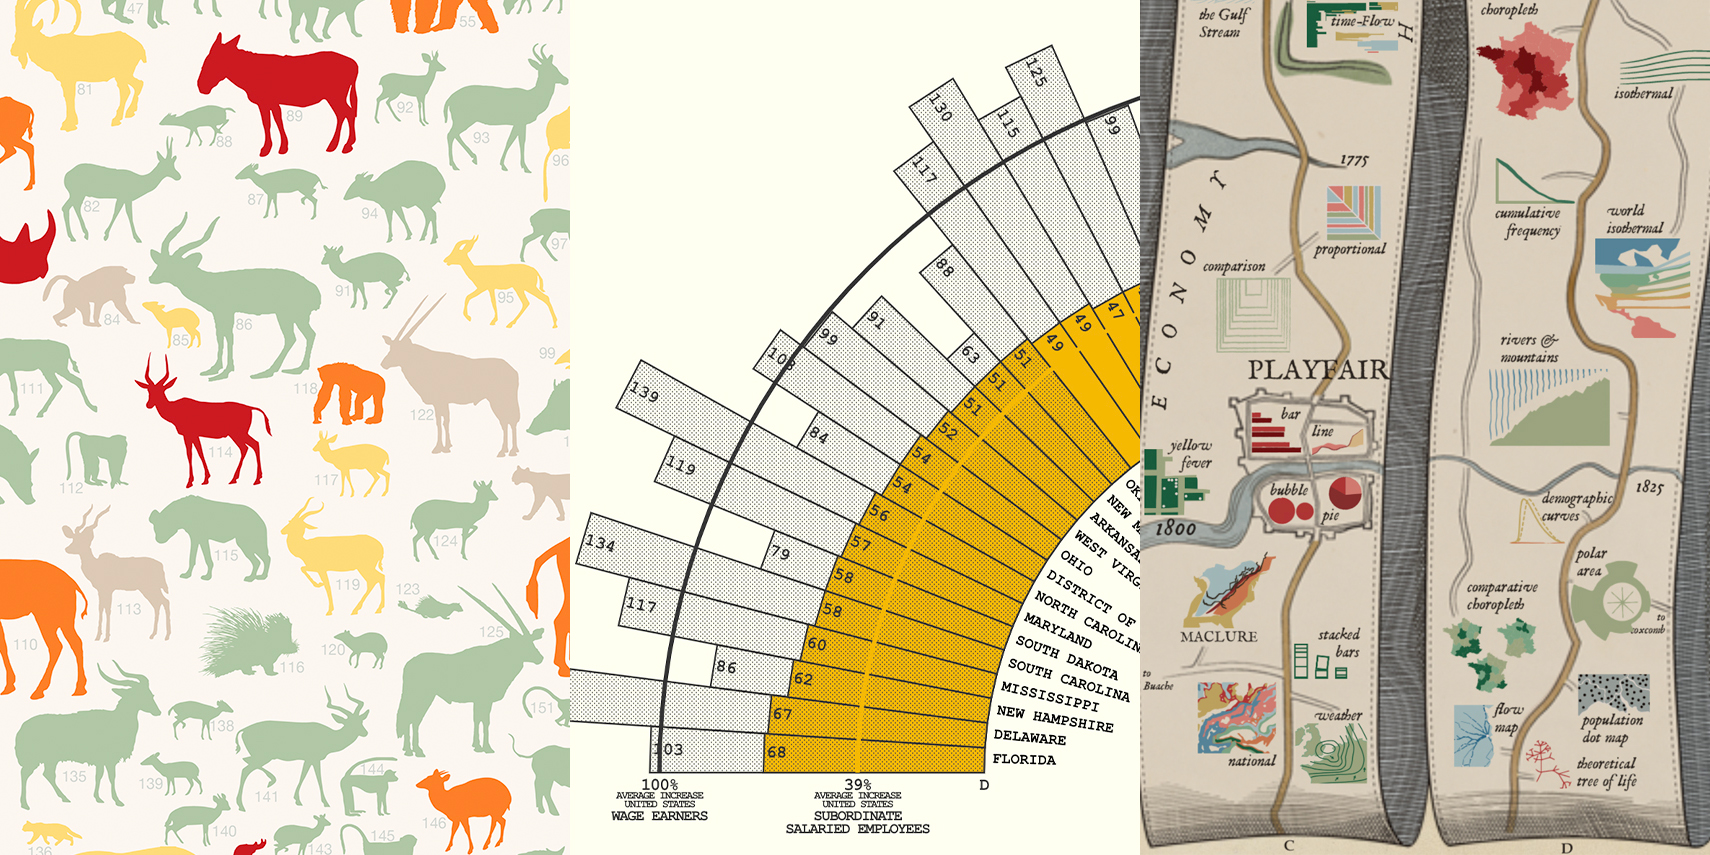
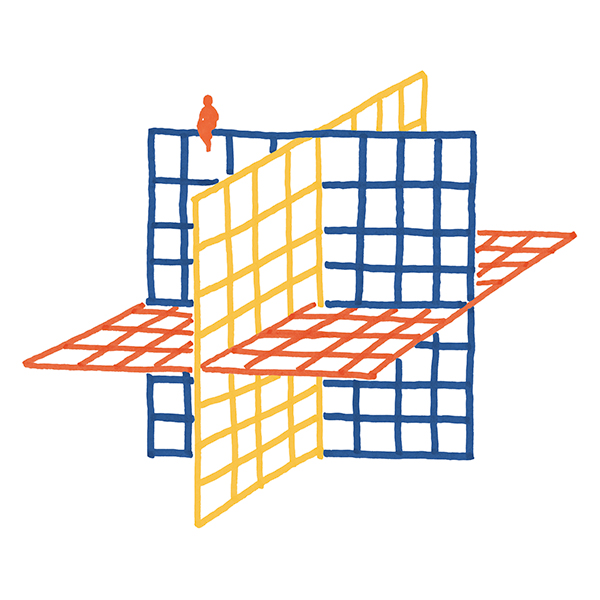
Powerful graphics bring data to life.
🚨
Attract Attention
Charts captivate and engage by focusing attention to the story, building trust with their clarity and impact.
🦚
Signal Worth
Sophisticated graphics are cultural expressions that signal a story is worth an audience’s consideration.
🌐
Grasp Context
A shared map for understanding complex information gets everyone on the same page about the broader situation.
Data visualization offers more than just analysis and insight—
information designs are at their most powerful as social tools.
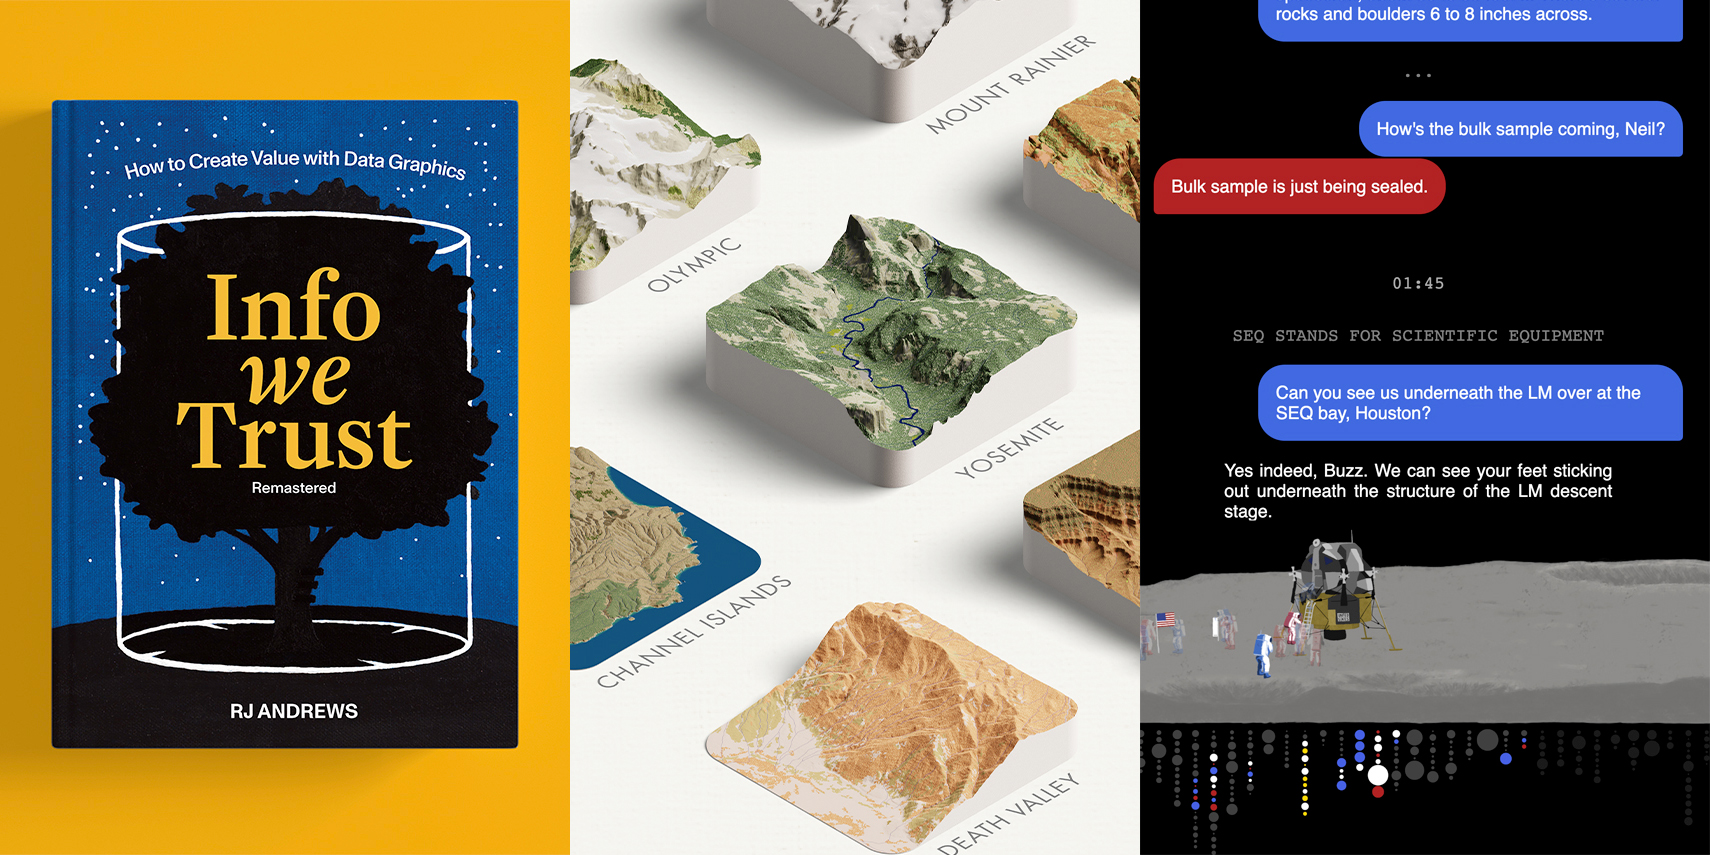


Some recent client projects
📍 Prototype novel ways to layer more data into world's largest mapping platform.
💰 Multifactor profitability and operations analysis for consulting firm’s thousands of clients.
📈 Designed analytic tools and reporting for large Silicon Valley venture capital firm.
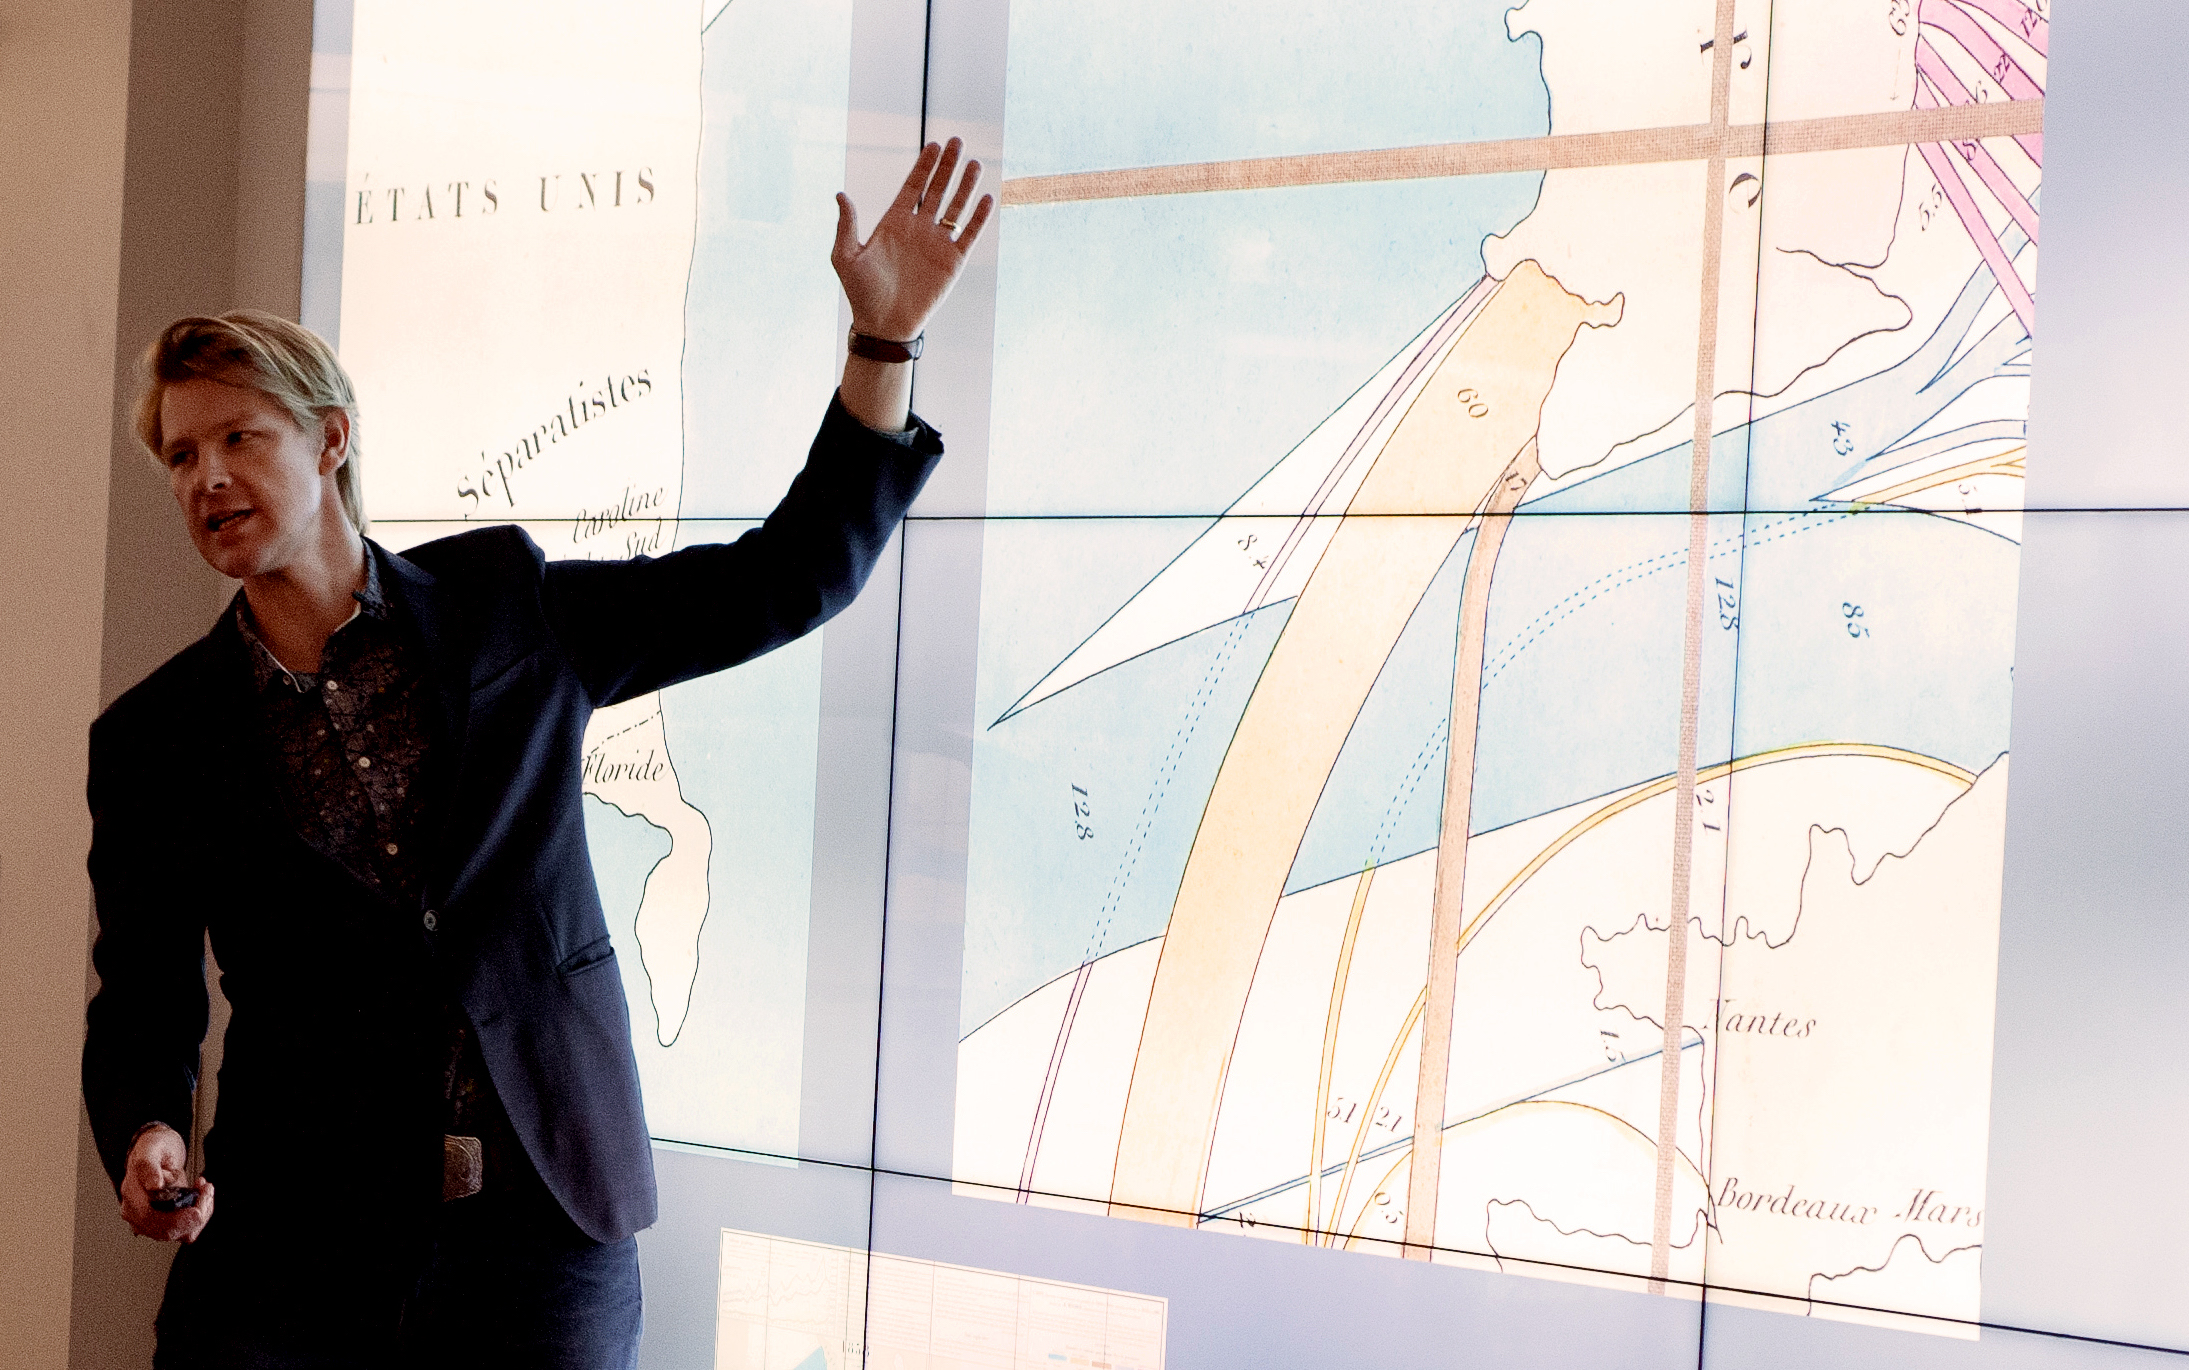
Data storyteller RJ Andrews is obsessed with data graphics.
He can help you solve high-stakes problems with inspiring visuals.
I'd like to learn a little about your information goals.
Subscribe
Methodology
Together we will create useful comparisons that help us grasp nuance, complexity, and insight. While every project is unique, these are typical stages:
1
Establish
Set the stage with available resources and desired information goals.
2
Explore
Creative probing through analysis, concept sketching, and prototyping.
3
Focus
Refine findings into a coherent package for intended audience.
4
Deliver
Final designs ready for implementation.
TOOLS
Paper and pencil are used in every project. Beyond these, I am technologically agnostic, designing with whatever best fits the goal.


RECENTLY USED TOOLS
Want to know more?
The best way to begin is with an exploratory call.
Learn
Teaching information design is integrated in all that I do.
Workshop
Learn how to generate insights and compel others to action. We will focus on data graphics while also exploring lessons from storytelling, writing, maps, and more. DETAILS
Newsletter
Information design inspiration and insights from charts and more are published in my newsletter CHARTOGRAPHY↗. Classic writing is archived in ESSAYS.
Books
Visionary Press↗ is my independent publisher celebrating data graphics with spectacular books about the craft of information graphics.
