Map of Firsts
Pictorial Interactive
300 years of information graphic milestones
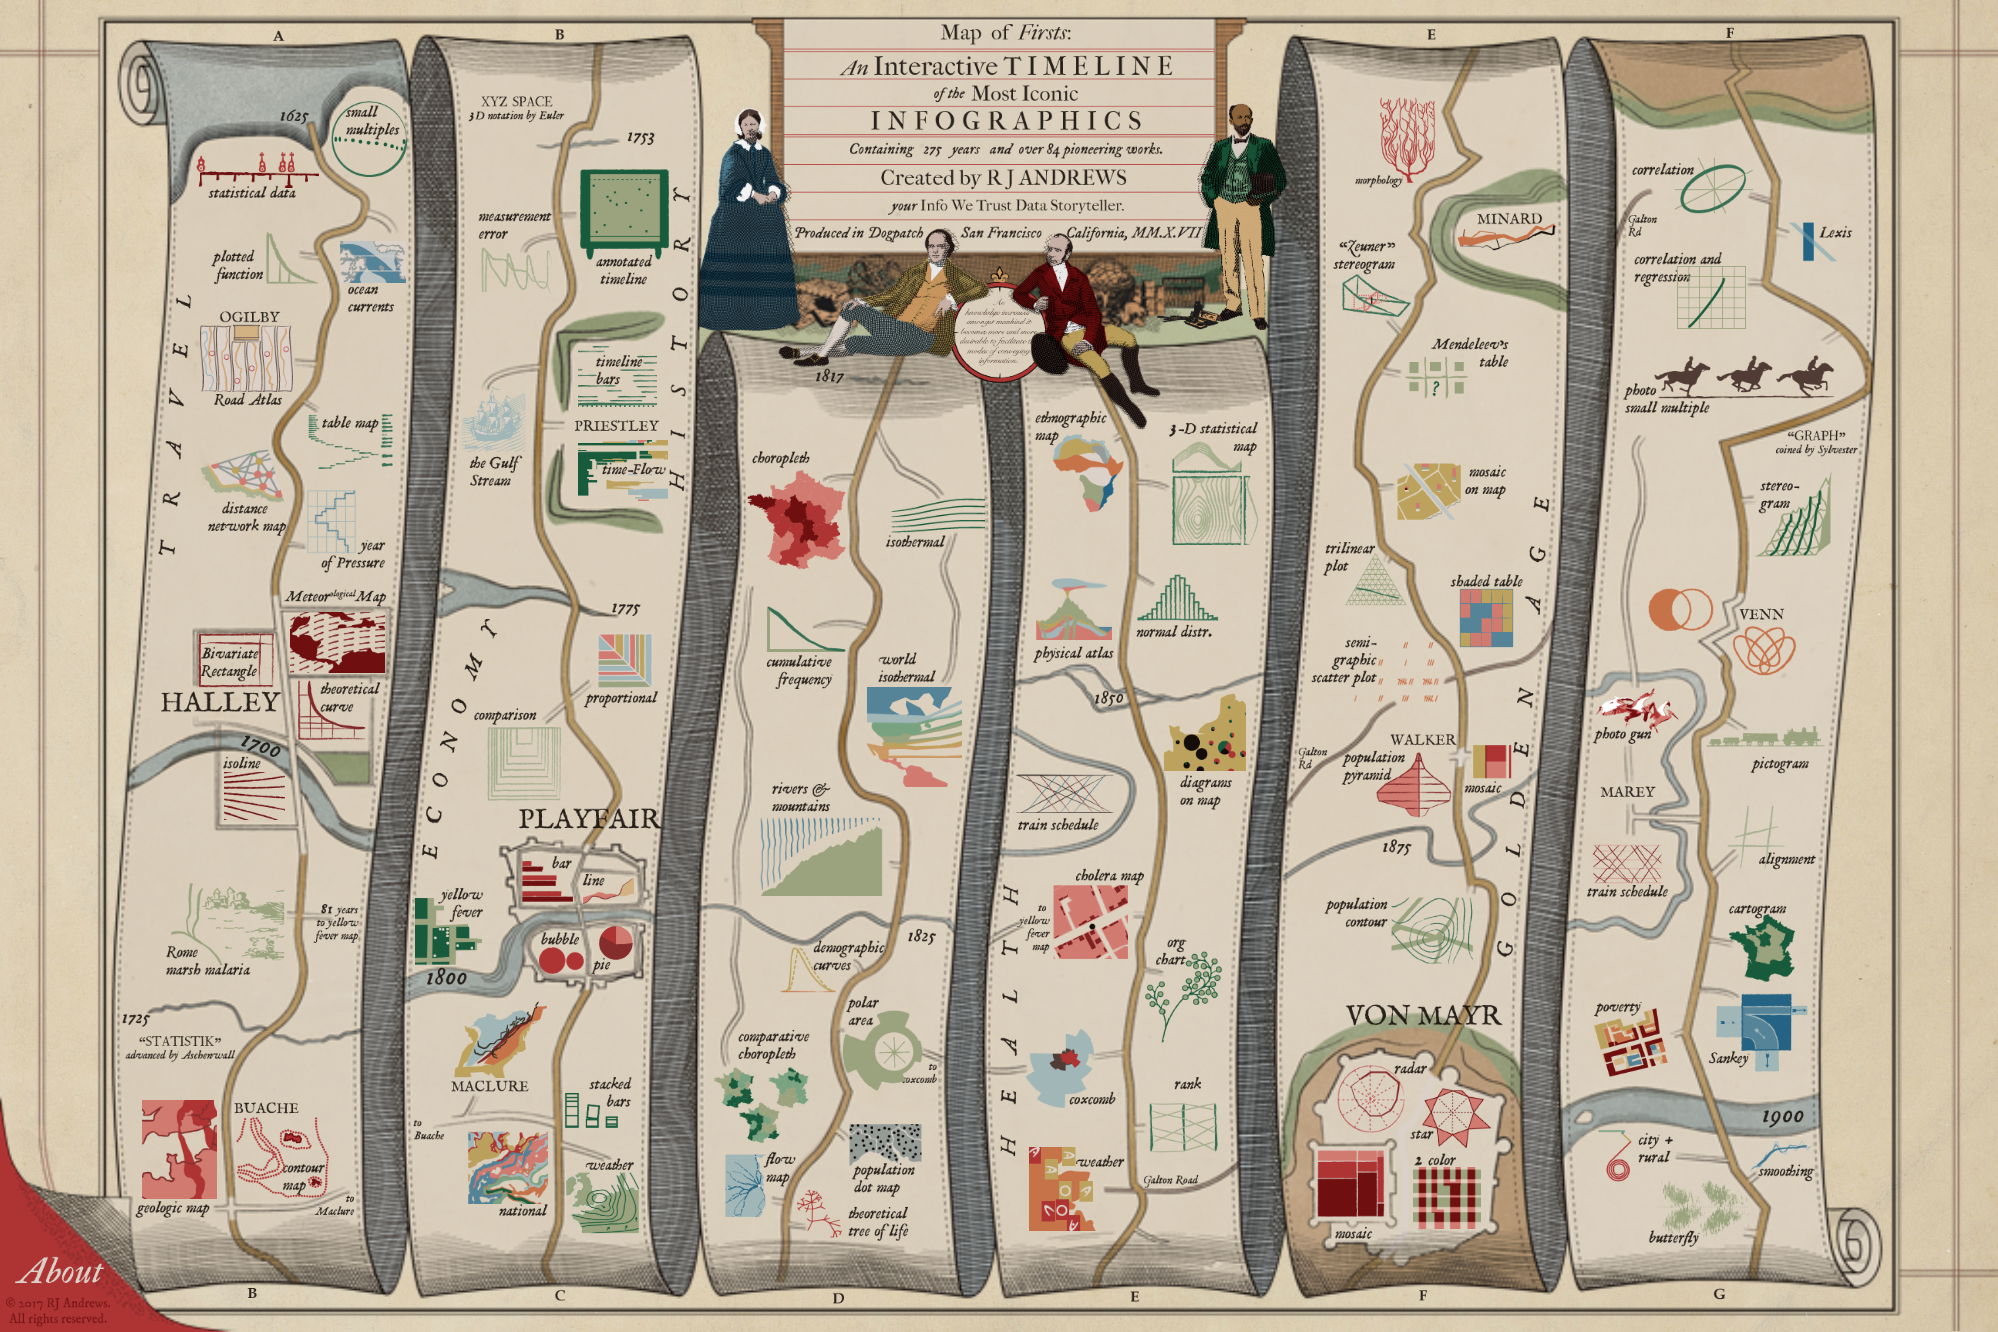
A full-screen interactive exploring the first 300 years of data visualization and information graphic history.
Cartoons represent milestone works of data visualization including inventive and influential works. They are placed along a fictitious timeline map in the style of John Ogilby’s 1675 Britannia atlas. The road marches you through time, passing many charts, through towns named for key contributors, and over waterways that mark important dates.
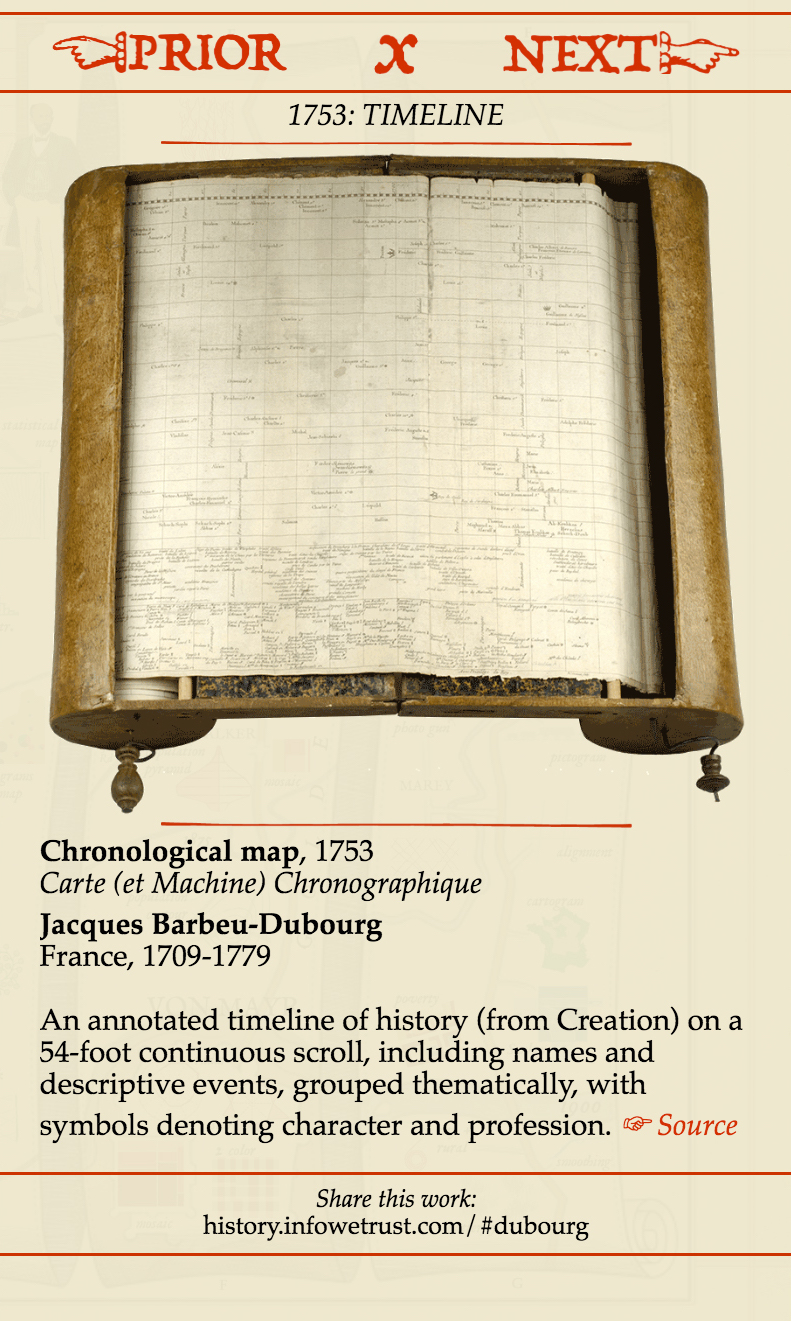
Selecting any milestone cartoon opens a side bar that shows you the original work and provides more detail. Click the button above to explore the interactive and read this project's design essay to learn more.

Info We Trust and Visionary Press are DBAs of Information Productions LLC, San Francisco.
Info We Trust ® is a registered service mark. © 2013–2026 RJ Andrews.