Explore the History of Infographics Interactive
The below work was translated to an interactive experience which you can enjoy by clicking the link above.
January 2017 Static Poster Design Essay
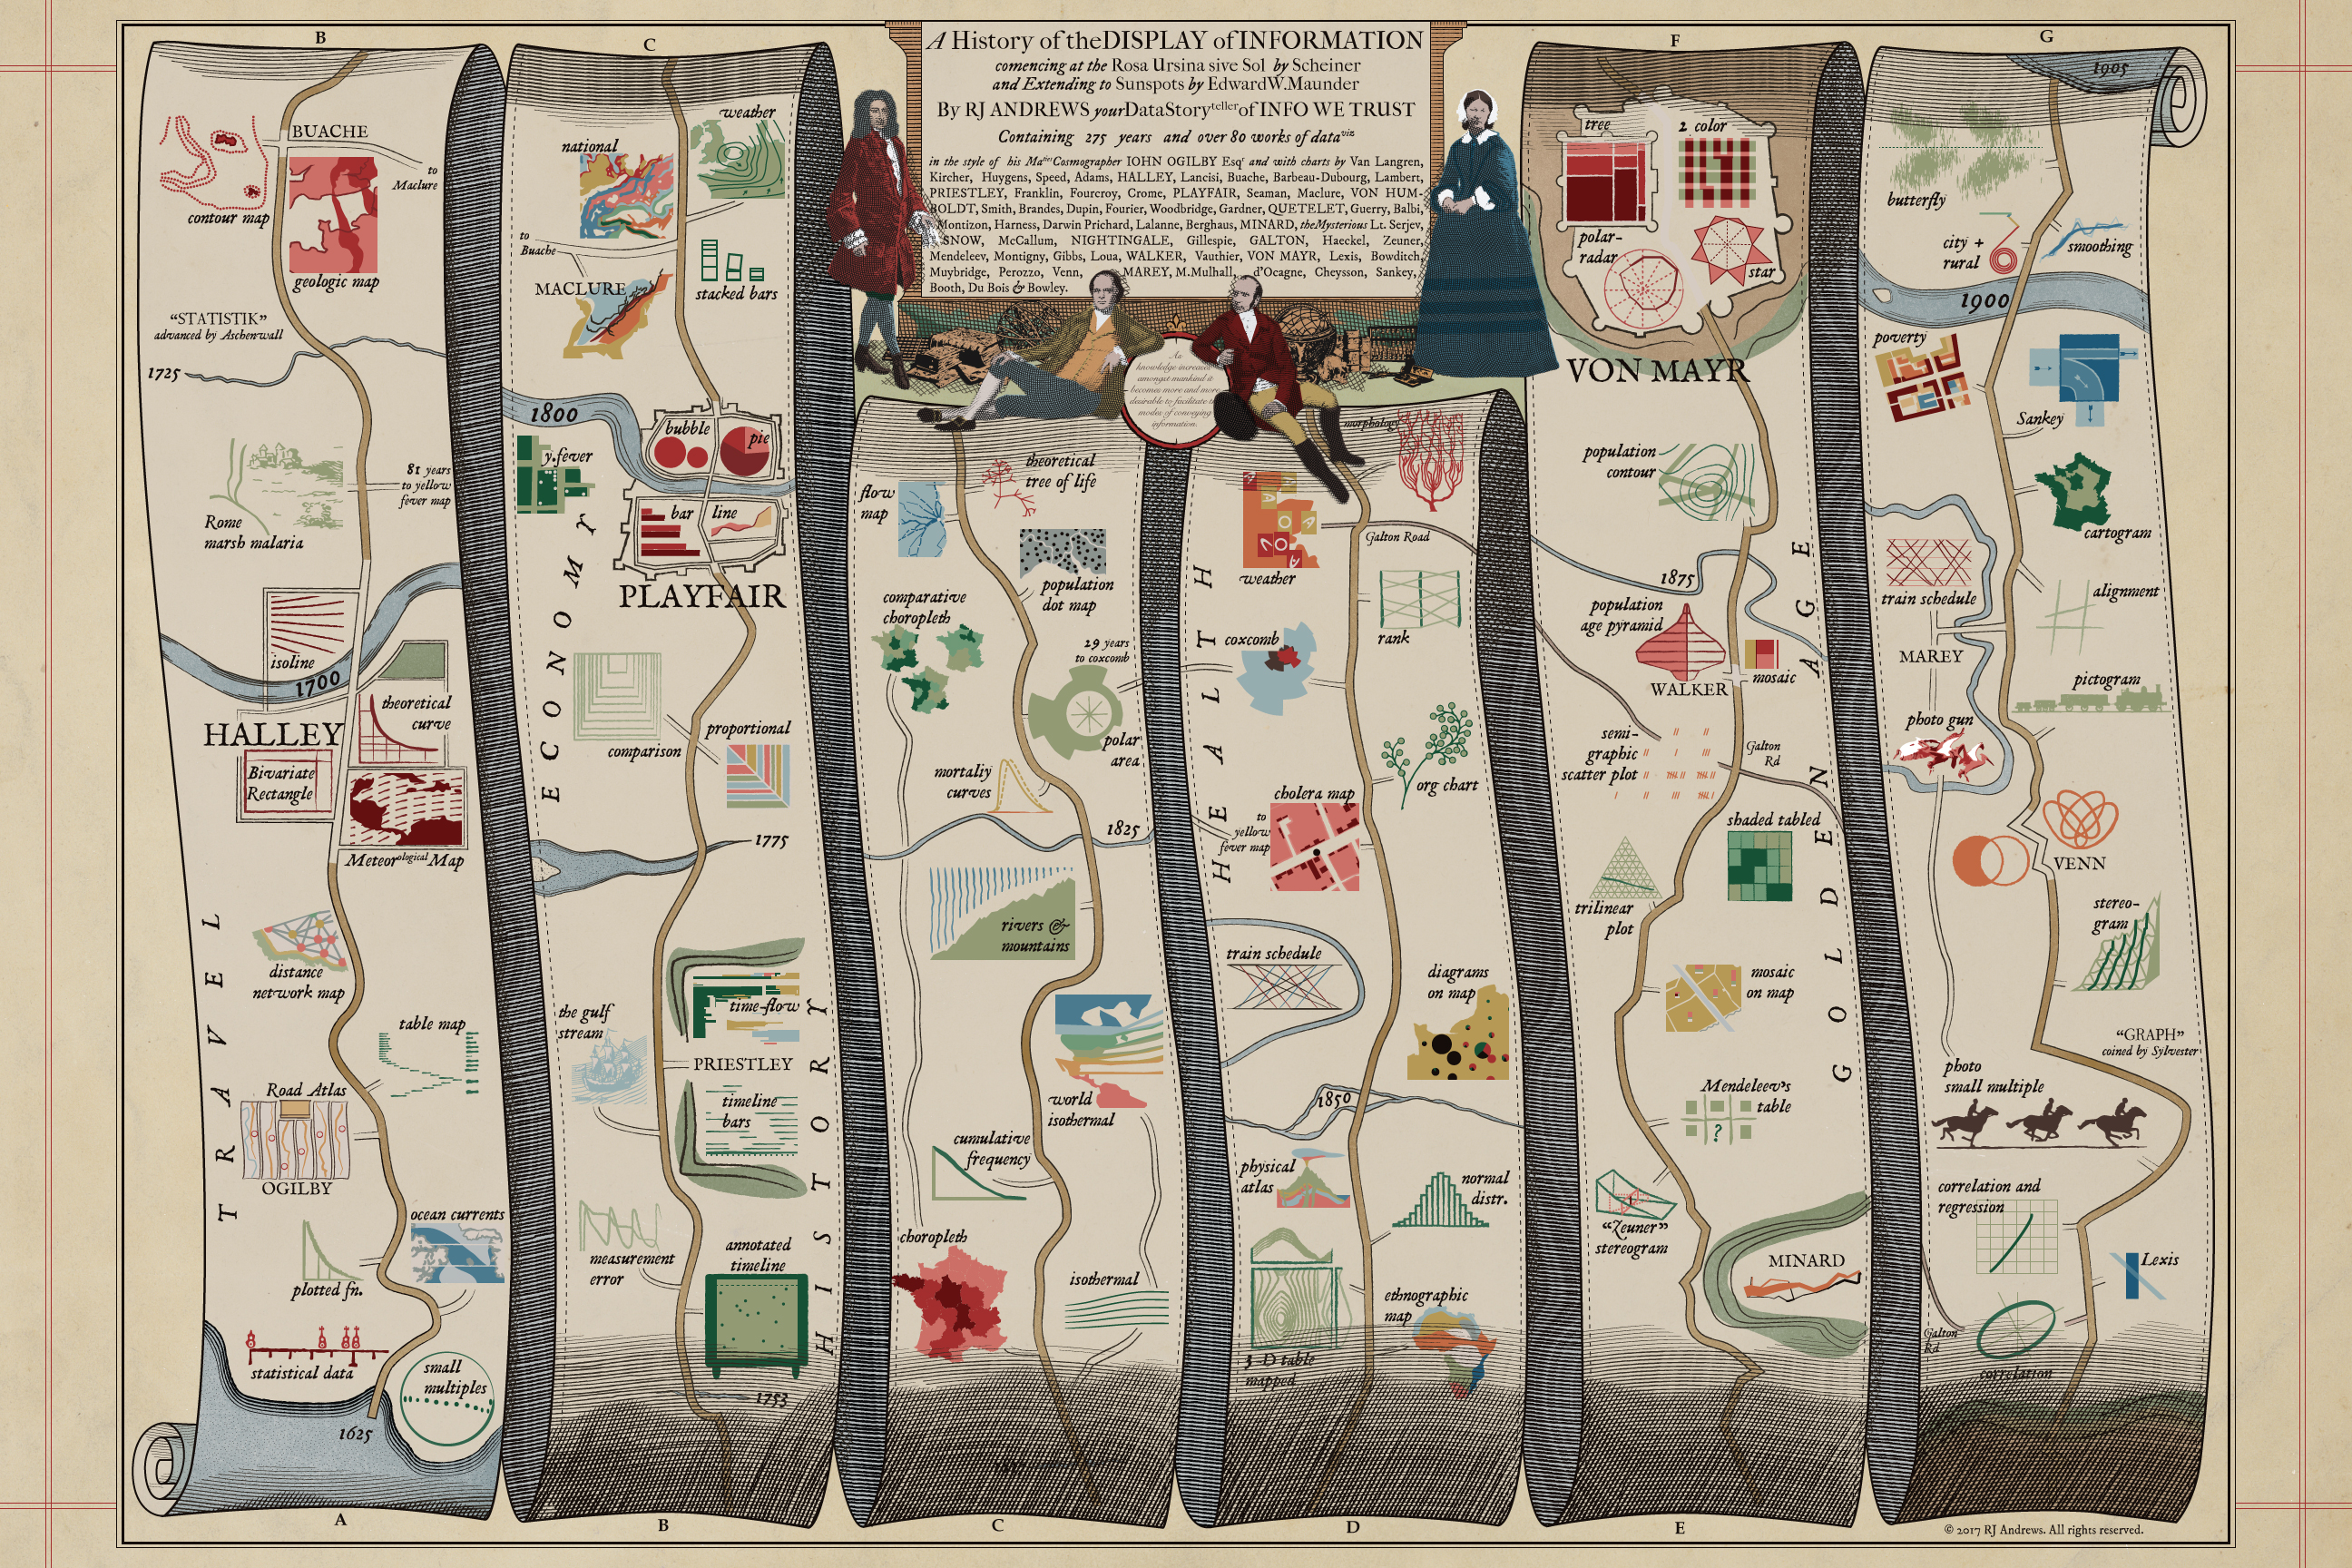
After examining the history of data visualization greats I have decided to collect my learnings in the style of history’s data visualization greats. The first of these visual summaries is presented and discussed below. You can explore the entire series here.
A map to guide you through the early developments of data visualization, including cartoons of 84 key charts, in the style of John Ogilby's 1675 Road Atlas. This image is sized for web-consumption and is only a fraction of the actual piece which can be properly enjoyed via:
