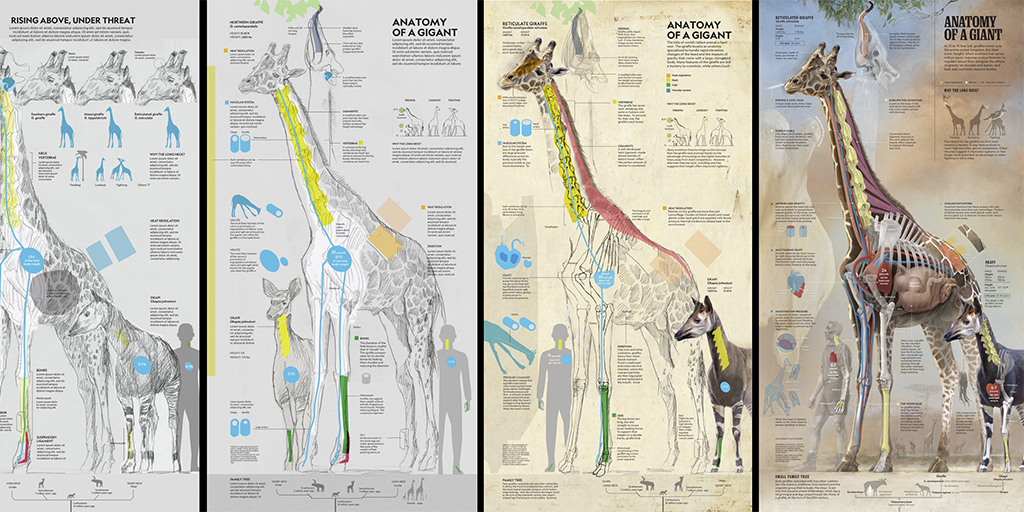
A design interview with Fernando G. Baptista about his giraffe marvel for National Geographic.
October 14, 2019 — Comments are off for this post.
Dissecting ‘Anatomy of a Giant’
October 7, 2019 — Comments are off for this post.
Florence Nightingale is a Design Hero
Founder of modern nursing. Feminist champion. Celebrity entrepreneur. Passionate statistician. Political operator. Data visualization pioneer. Florence Nightingale was all of these, yet none capture Nightingale’s seminal effect — something better felt through her prose:
It is as criminal to have a mortality of 17, 19, and 20 per thousand in the Line, Artillery and Guards, when that in civil life is only 11 per 1,000, as it would be to take 1,100 men out upon Salisbury Plain and shoot them.
The Englishwoman who wrote take 1,100 men out upon Salisbury Plain and shoot them. That’s the Florence Nightingale I want to understand.
Read moreJuly 17, 2019 — Comments are off for this post.
NEIL AND BUZZ: Design Essay
January 17, 2019 — Comments are off for this post.
Eighty Weeks
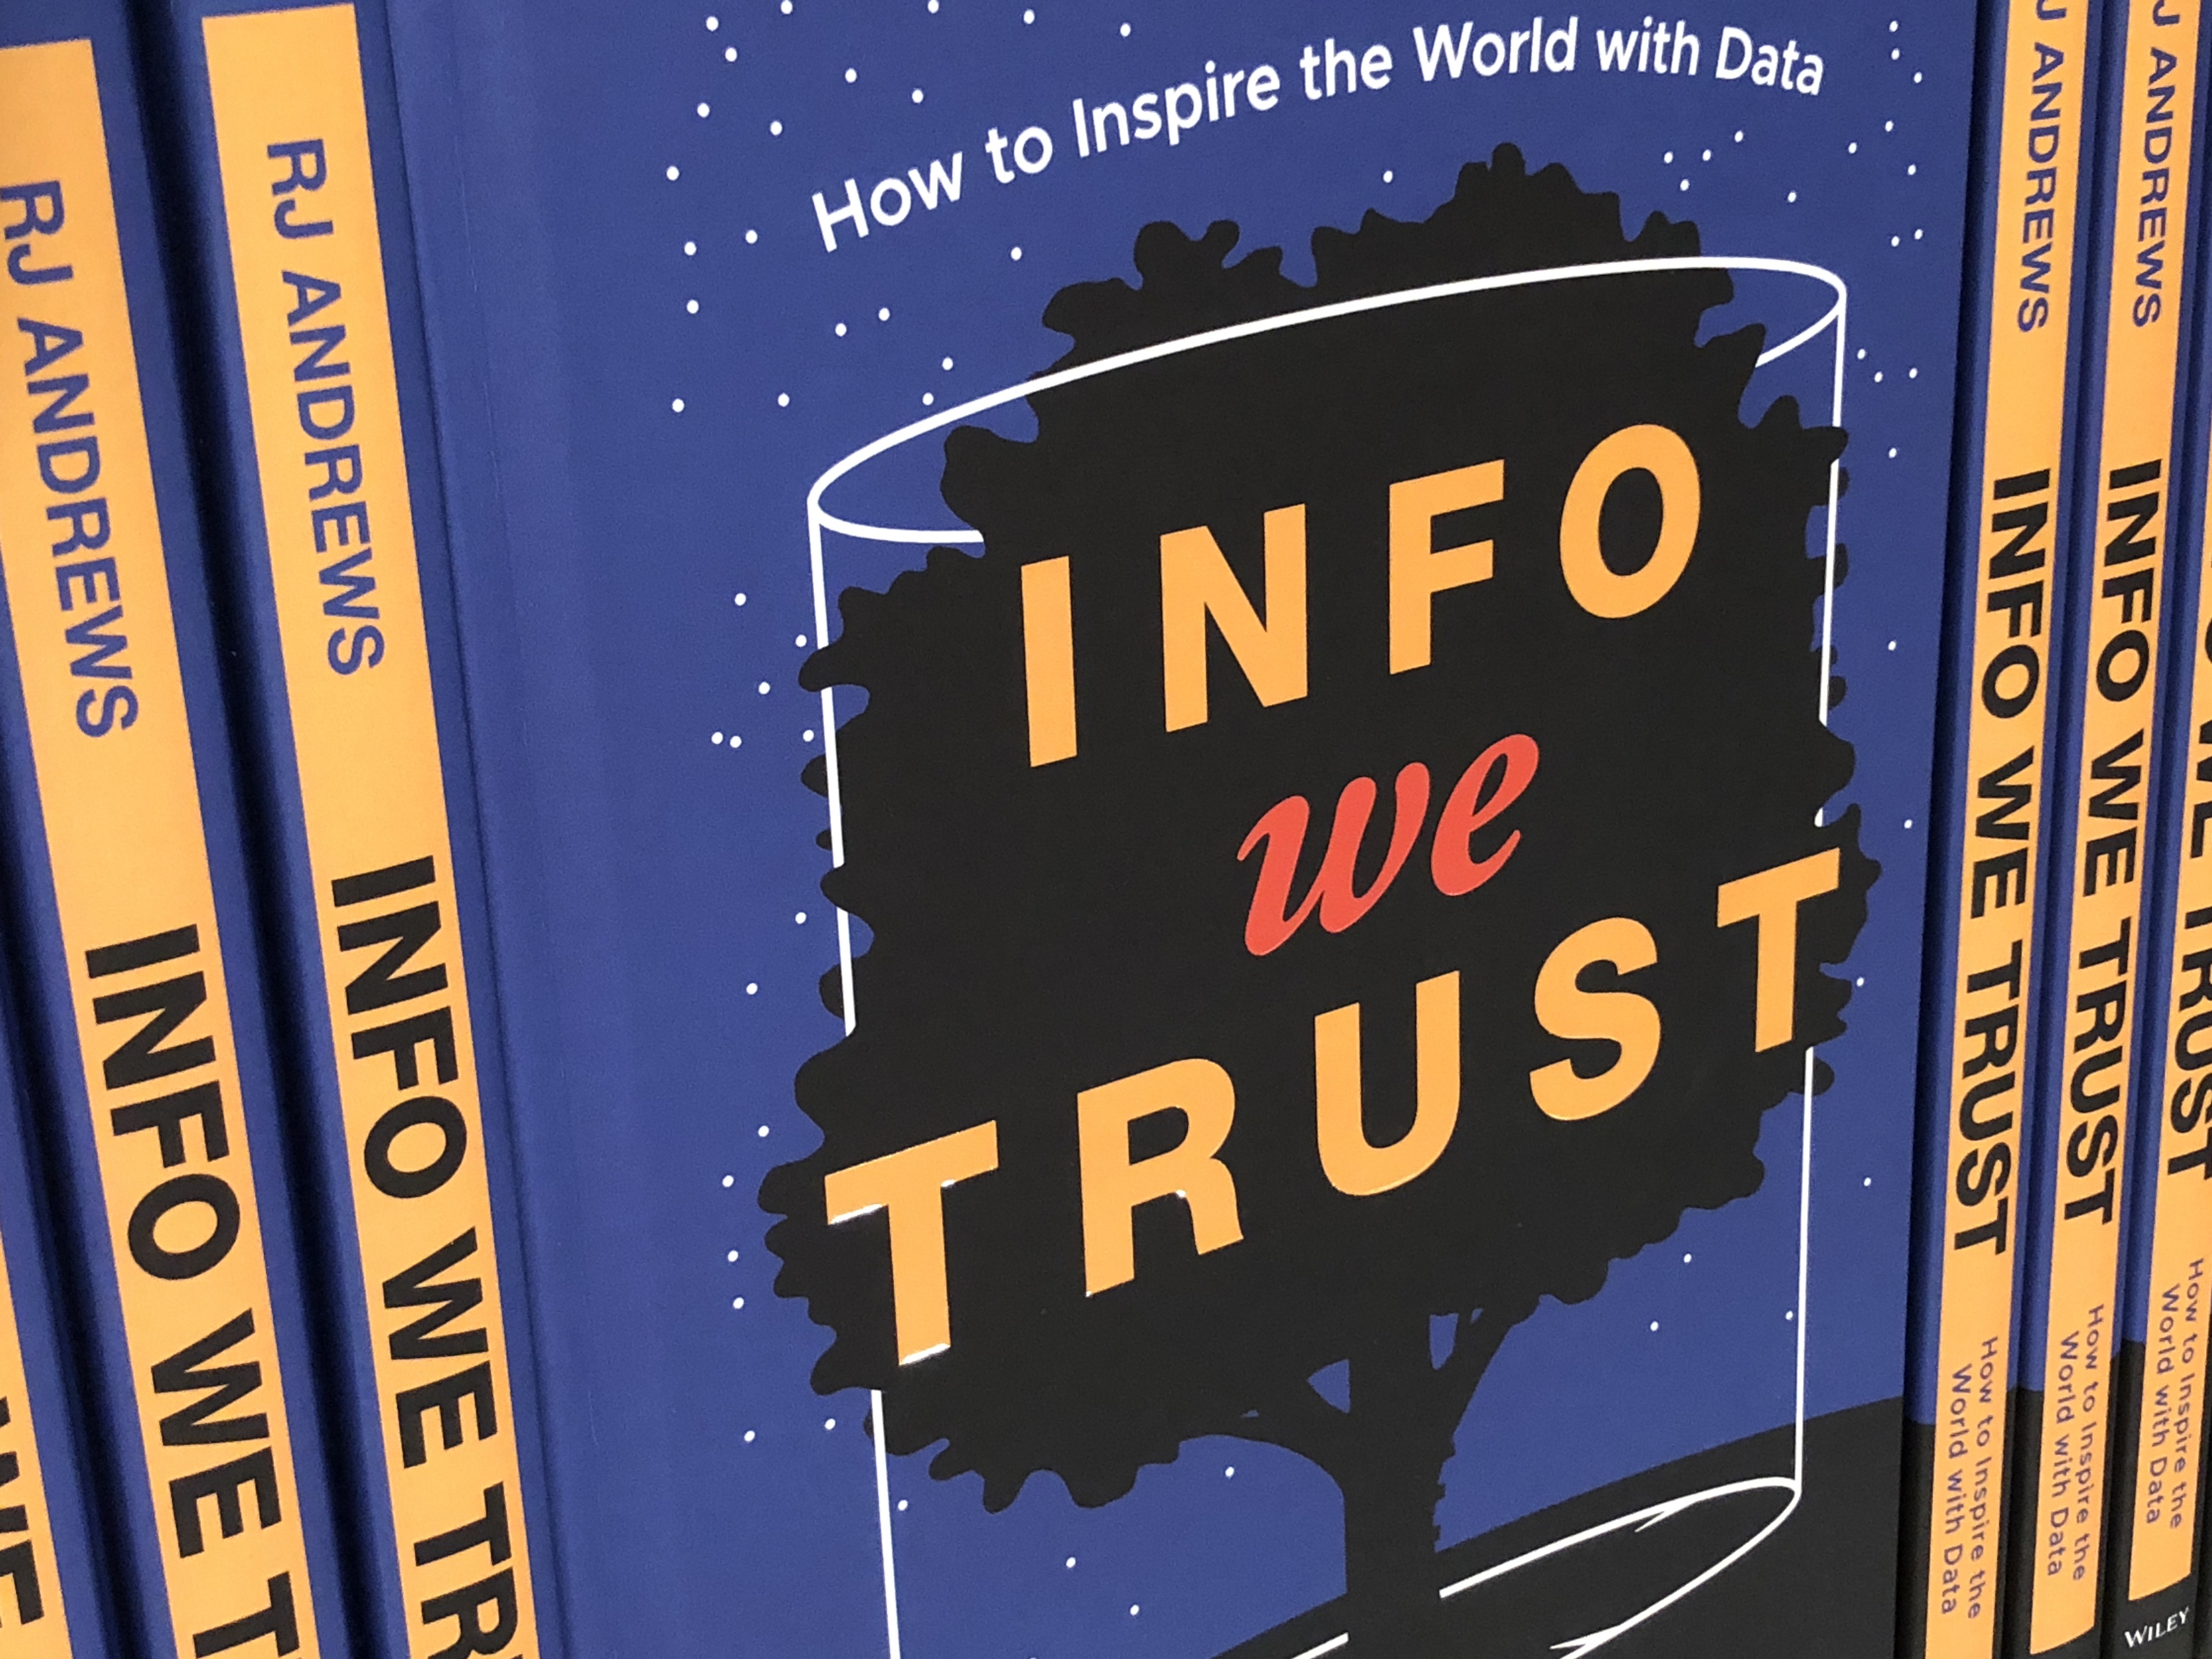
Info We Trust was published today. This essay, one in a series about making Info We Trust, is a mildly quantitative reflection on the road from the first pitch (week one, or, ʷ1) to publication (ʷ80).
Read moreJanuary 3, 2019 — Comments are off for this post.
Packaging
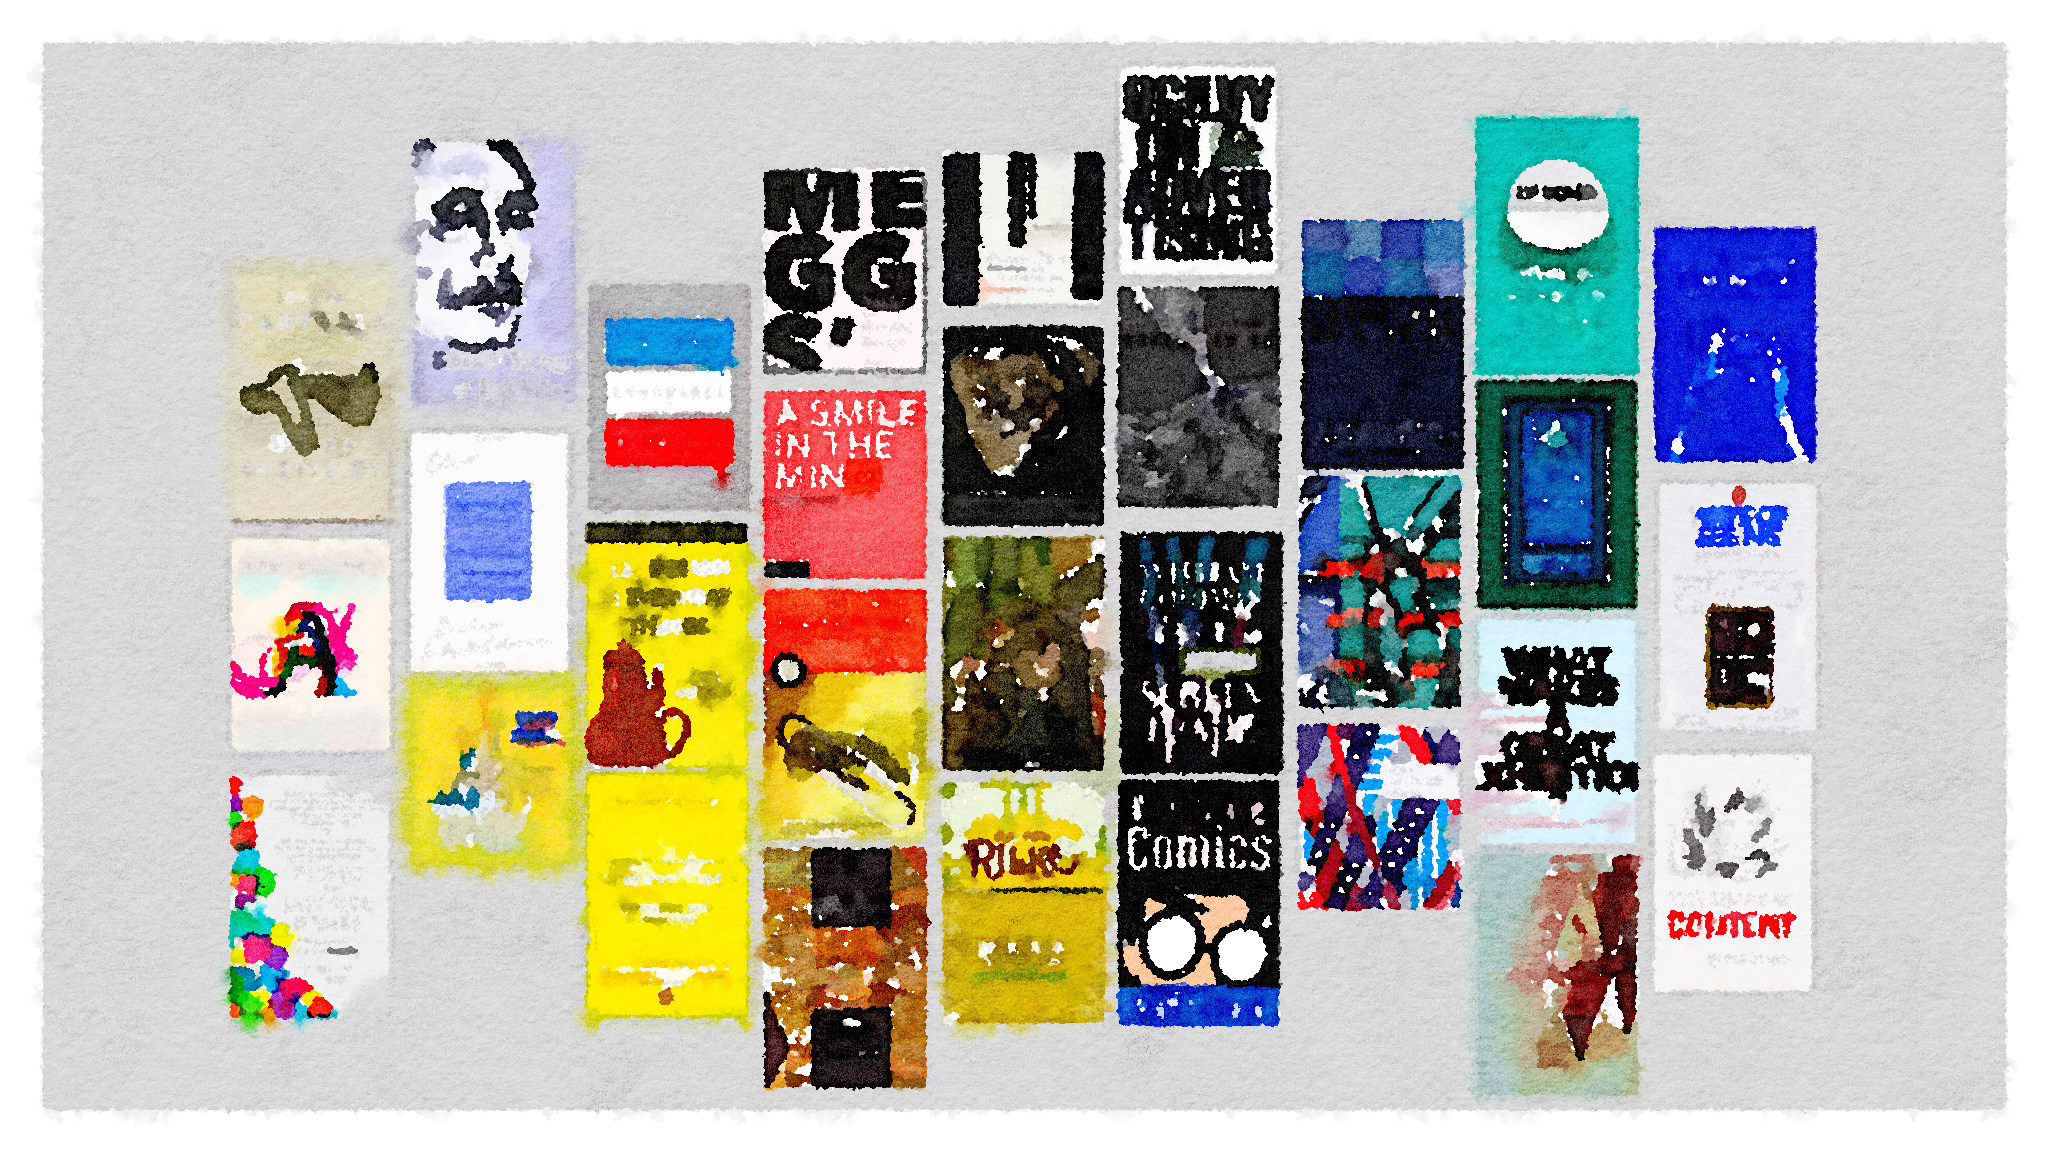
The book cover is a tricky design challenge. It has to attract attention, differentiate the book from the competition, and convey some idea of what’s inside. The cover must work online as a fuzzy compressed icon smaller than a postage stamp. The same cover has to work life-size on a bookstore display. And all this has to be solved long before the author completes the first draft.
Read moreDecember 18, 2018 — Comments are off for this post.
Writing is Hard
I do not remember writing Info We Trust.
It certainly happened. I can tell you about the room I worked in and the keyboard I banged on. I can even analyze its two dozen drafts and describe my process. But I do not have any real emotional memory of a particular moment of actually doing the writing.
Read moreDecember 10, 2018 — Comments are off for this post.
Information Arts
December 5, 2018 — Comments are off for this post.
Multiple Narratives
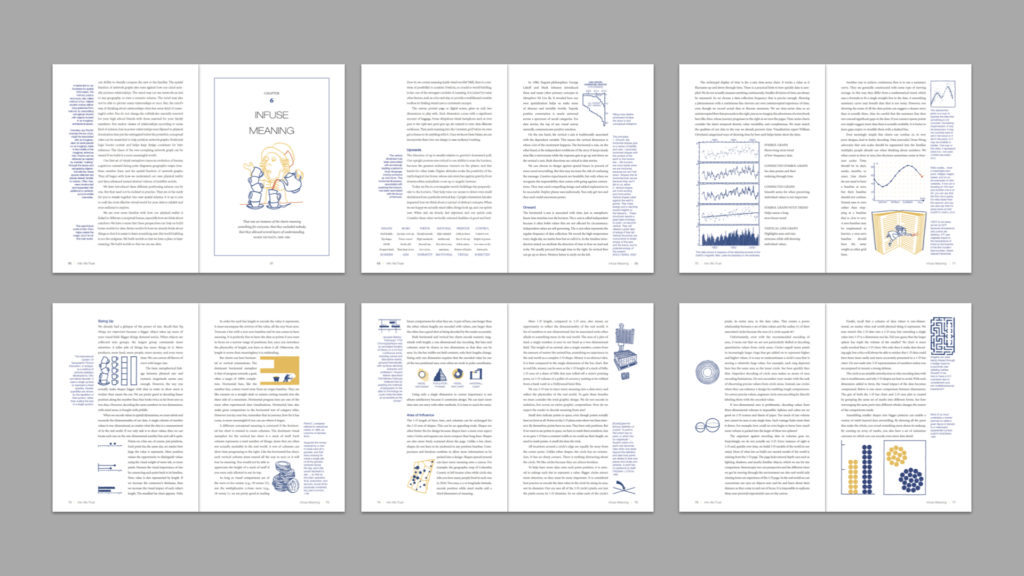
Info We Trust (the book!) is built on a graphic system that weaves three narratives into one harmonious flow. The main text in black is the page-turning workhorse. The illustrations put the lessons into practice (read about them in "Hand Drawn"). Marginalia adds color in the blue margins.
This essay is all about book design. It especially details how the book’s layout supports Read more
November 28, 2018 — Comments are off for this post.
Hand Drawn
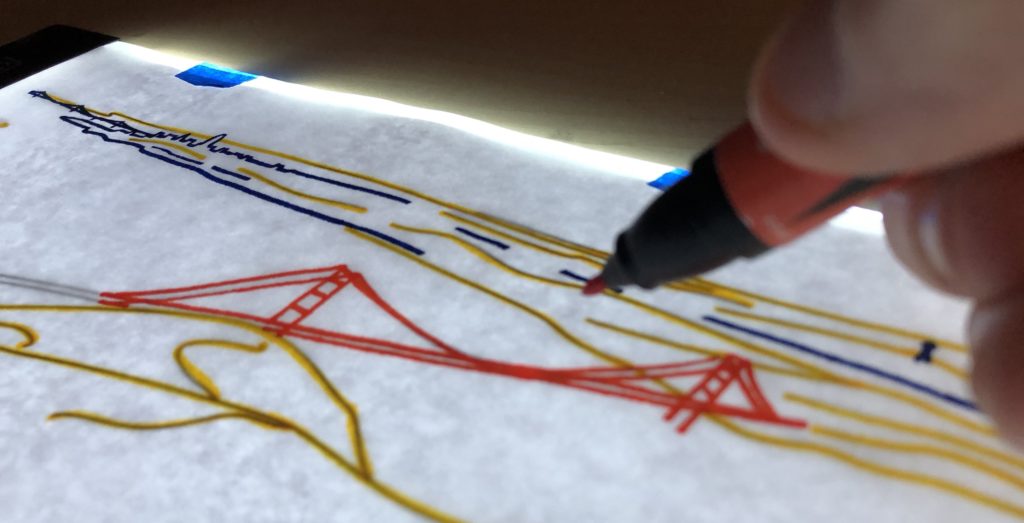
Info We Trust is packed with hundreds of illustrations I drew just for this book: over 300 new charts, diagrams, maps, and depictions. There are full-page data stories, tiny ditties in the margin, and everything in between.
Committing to hand drawn illustration defined the feel of this book's storytelling adventure. This essay explains my thinking behind Read more
November 23, 2018 — Comments are off for this post.
Contents Galore
Today in America it is Black Friday, a day named for a qualitative color palette: retail ledgers go from red (debt) to black (profit) with the explosion of holiday shopping.
In honor of today’s consumerism, I thought it would be fun to share with you something you can consume.
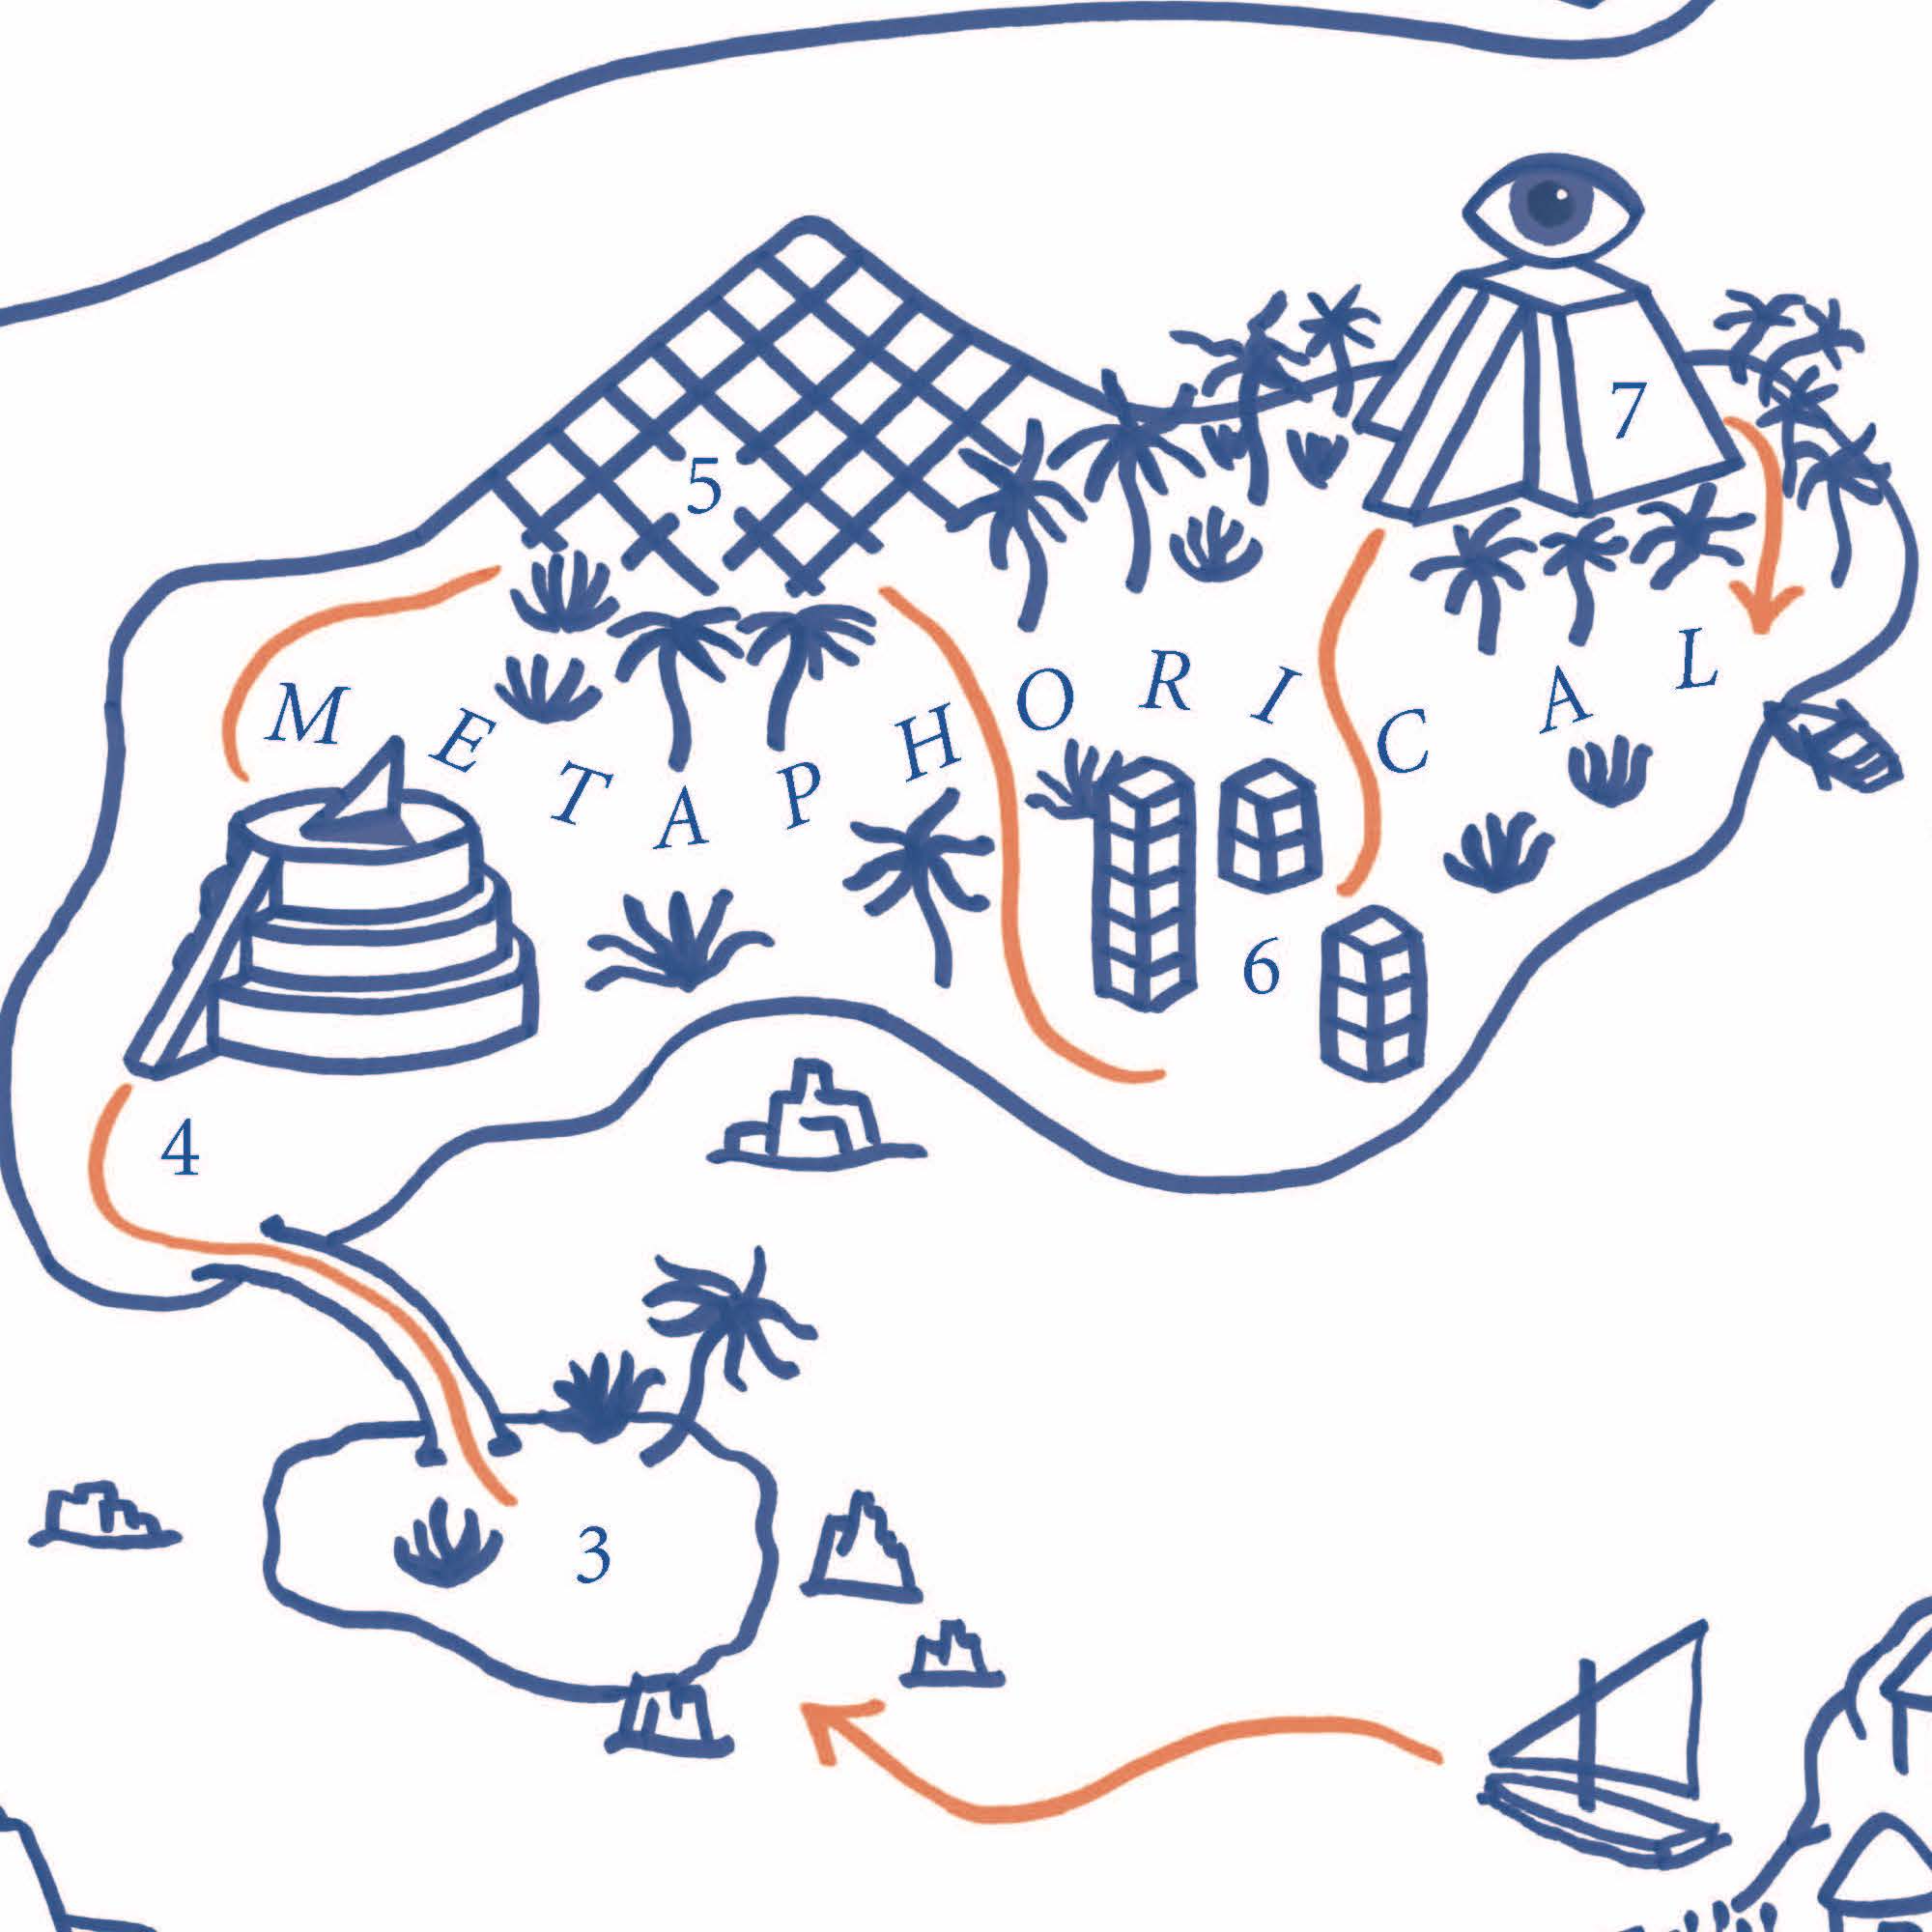
Below is a little peak inside INFO WE TRUST. And what better place to start than at the top: the book sports both a Table of Contents and a Map of Contents, across one big spread. Read more
