This essay documents the design thinking behind a data story I created in celebration of the 50th anniversary of Apollo 11: NEIL AND BUZZ GO FOR A WALK. Go enjoy the story. It is best on a big screen like a tablet or monitor (show up with a tiny screen: get a tiny experience). Then come back here for a behind-the-scenes tour.
Concept
NEIL AND BUZZ was motivated by a realization: I had no idea what happened on the Apollo 11 moonwalk beyond Neil's ONE SMALL STEP and that iconic flag photo. How many moonwalks were there? Just one. How long were they out there? About two hours. How far did they explore? An area about as big as a baseball diamond. What exactly did they do?
To answer these questions I dove into a wealth of NASA resources. Almost immediately I was struck with a the vision of a scrolly tour through moonwalk highlights. I made this little doodle in my notebook and documented:
Goal: convey the scale - both space and time - of first moon landing. Also: Distinguish what each Astronaut did. Give context for the iconic media (quotes and photographs).
Style: maybe watercolors and ink for maximum WOW. Could animate some into simple GIFs.
Source Data: detailed mission map + mission log
Structure: Static scrolly-telling timeline narrative of all the key moments. Key visual is a perspective view of the landing site.
Question: how many stages/events should be illustrated?
I stayed pretty true to the core vision of this sketch. The perspective view, transmission excerpts, and color-coded astros remain. The sketch reveals that some things changed. I originally wanted to bookend the story with the LM's landing and ascent (this timespan contracted). I first envisioned a static experience (this expanded).
The vision in this doodle represents one of the ways data stories begin. You have a mental form for what you want to see, and are eager to put in the work to populate it with the proper content.
Data wrangling
With a vision to realize, I set to work. Research consisted of triangulating several Apollo documents:
- USGS Traverse Map and Television & Photo Map
- Transcription of the Technical Air-to-Ground Voice Transmission
- Apollo 11 image library and its excellent commentary
- Restored Moonwalk Video
- Apollo 11 Mission Report added context (and a style reference)
I bounced between these resources to develop my own feel for what happened on the moon. Humor, excitement, and professionalism resonated across the recordings. Too many looks at the history of space exploration are too cold—too machine. The humanity of the Apollo 11 accomplishment can be felt through its surviving documents.
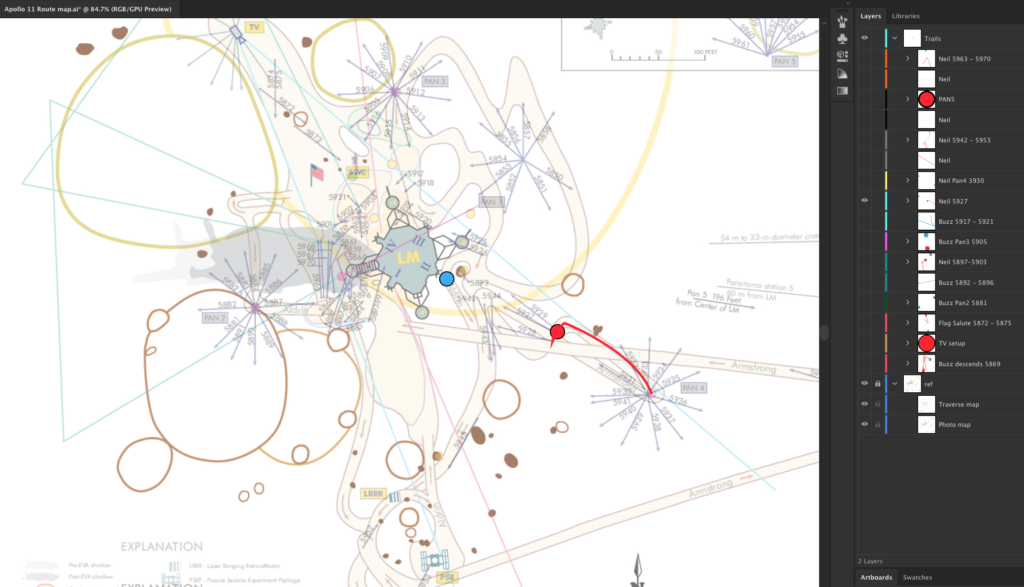
The Hasselblad photos are the data linchpin to this story. NASA has published where and when each photograph was taken. Match the photography to the transcript timeline and USGS map and you can assemble a spatial-temporal understanding of the moonwalk. I constructed a set of planning documents to help me organize my understanding of the mission:
- Transcript spreadsheet: I put the entire transcript in a spreadsheet, one row per transmission. This let me flag what I thought was interesting—what would make it into the data story. Columns of annotation link transmissions to photos and details about what was happening.
- Illustrator layered map: a layer for each position and motion trail of Neil and Buzz (below):
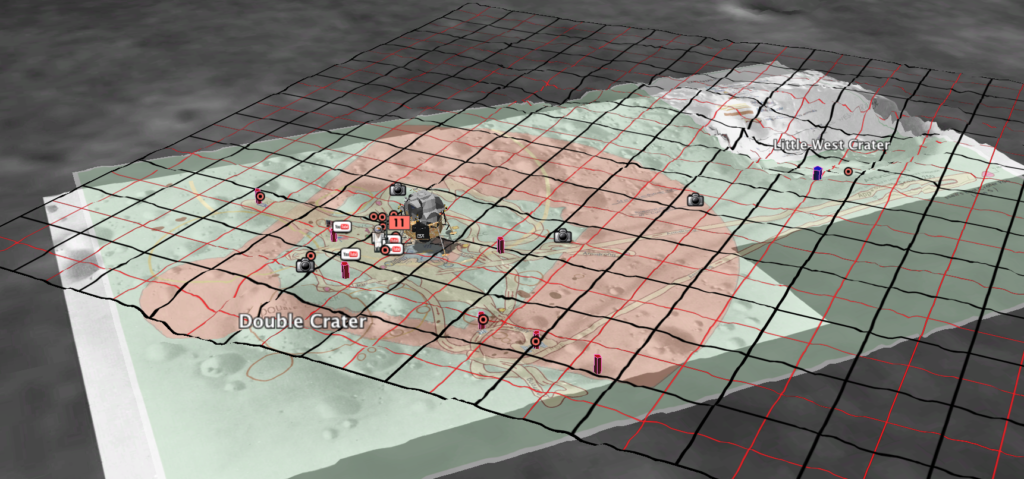
- 3D model: I layered these overhead map resources into Google Earth's Moon. 6 ft tall columns stood for astronauts at key positions. Then I flew around the model to figure out the right perspective for story. I needed a vantage that would show off the most exciting action while not occluding anything.
One piece of data that got cut from the story, but that I still love, is Neil and Buzz's heart-rates during the moonwalk. Originally in two separate charts, see them layered (below) and colored to match the characters in the data story.

Notice Buzz's relative coolness (in blue) and Neil's elevation (in red) near the end of the walk. The large spike in Neil's heart-rate (begins near 111:10) is his unscheduled sprint to-and-from the Little West Crater.
Across all my study of this data I stayed close to primary sources. A search of the National Geographic archive showed no existing work on this specific moonwalk. Otherwise I stayed away from looking into prior work. Halfway through the project I watched the fantastic 2019 Apollo 11 documentary, which really inspired me to keep going.
Story design
The entire Apollo 11 story is seriously interesting: How NASA got to Apollo. How Apollo systematically got to Apollo 11. How the big big rocket is really big. All of the orbital maneuvers. The thrilling manual landing on the Moon.... it's all so fascinating. A lot of stories try to explain it all. But that was not my charge. I had a specific question to answer: what did they do on the walk?
All of these actions are fascinating in their own way, but would delay me from getting to the walk. I decided to begin at the moment the Lunar Module hatch opens, and shut the story down when the hatch closed. I re-clocked the timeline, setting the moment the hatch opens to 00:00.
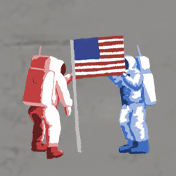
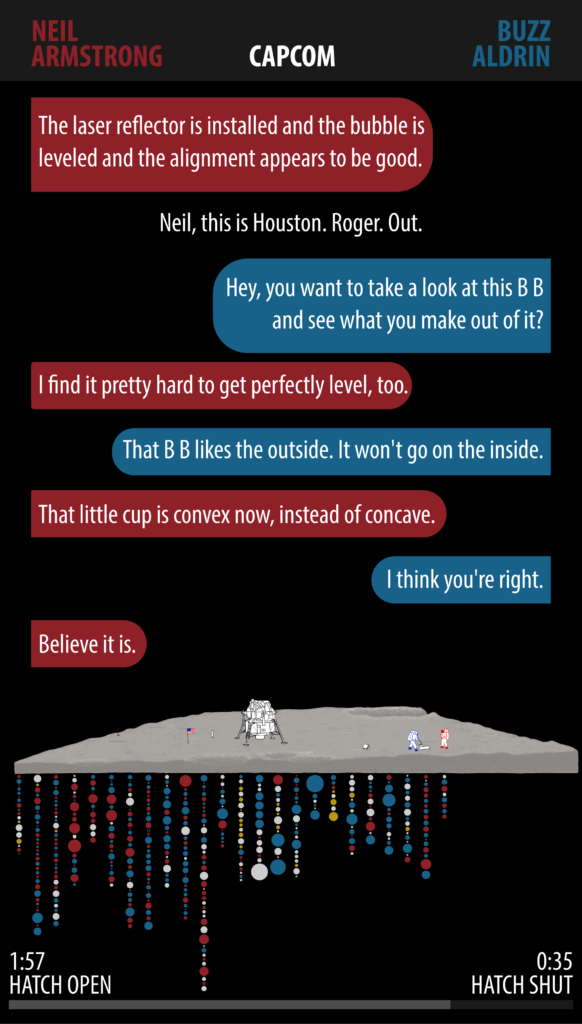
Color distinguishes Neil and Buzz's action and dialog. Commander Neil Armstrong received red as homage to the red commander stripes worn on future Apollo missions. Buzz patriotically balances with blue. Mike Collins, orbiting above, got yellow gold for his cameo, filling out the primary palette.
Only a small portion of the moonwalk's transcript is featured. My goal was to give a sense of the moonwalk that was accessible to many in 5-10 minutes. I did not want to create a feature-length film or exhaustive interactive dashboard. Only the spiciest parts of the transcript stayed. The piece is a data story. It is edited for maximum effect.
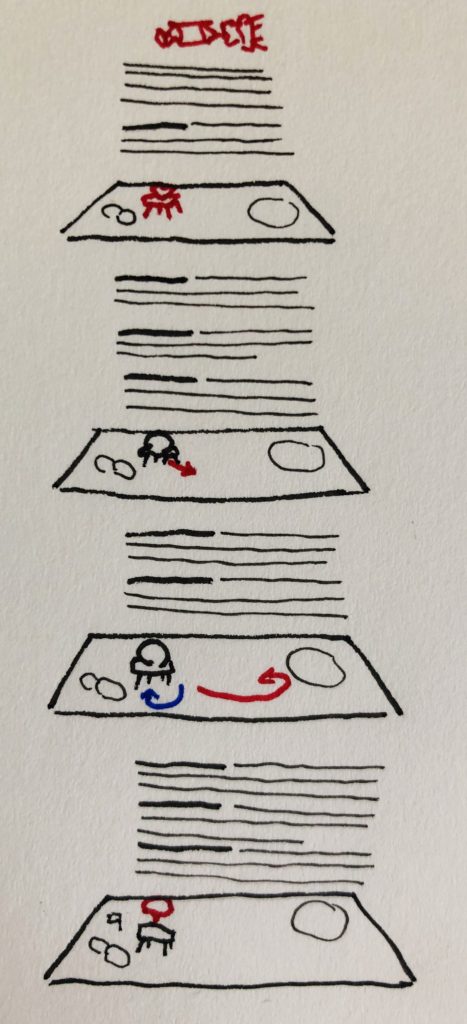
I created a storyboard-script that tracked the walk scene-by-scene (below). This helped me figure out what stayed and what went. Now we have a lot of new illustrated elements in the mix, let's talk about them next.

Illustration style
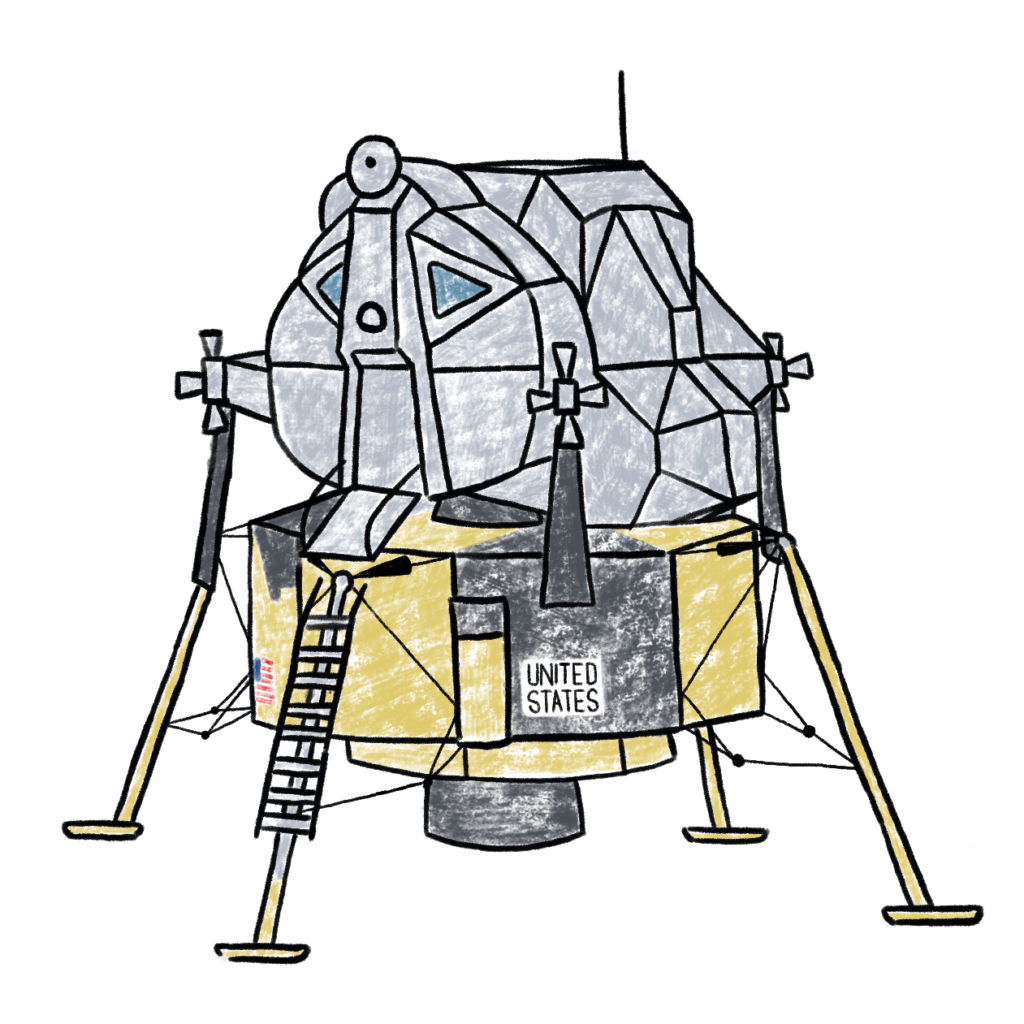
From the original vision I wanted to hand illustrate this story. Hand illustrations help humanize the adventure. I also believe they are really fun. The Lunar Module Eagle was at the center of the story and the element I worked with to nail the story's look. Here's an early line art drawing with sketchy fill:
The theatrical stage for this story is a tiny piece of the Moon called Tranquility Base. A direct overhead map view of Tranquility would put everything in better proportion. However, the same overhead view bars the viewer from appreciating the human scale of the area. An overhead view also shrinks astronauts to meaningless dots. Instead, I take an oblique (or perspective, or diorama) view of the Moon:
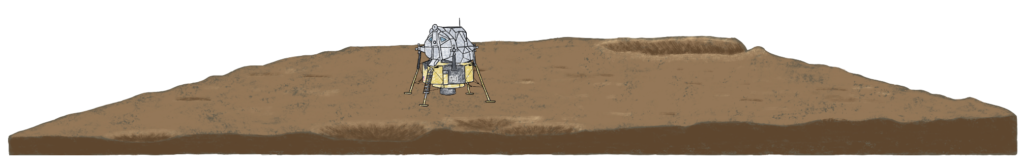
The moonscape emphasizes the main craters and fills the rest with good-enough texture. You may notice that the original illustration looks very different from what's in the final piece. The color of the moon is a really fascinating phenomenon. It is more brown than you think. Without an atmosphere, it changes wildly in appearance in different lighting. I illustrated it in brown and then modified the color later to provide the best stage for the storytelling elements: the astronauts.
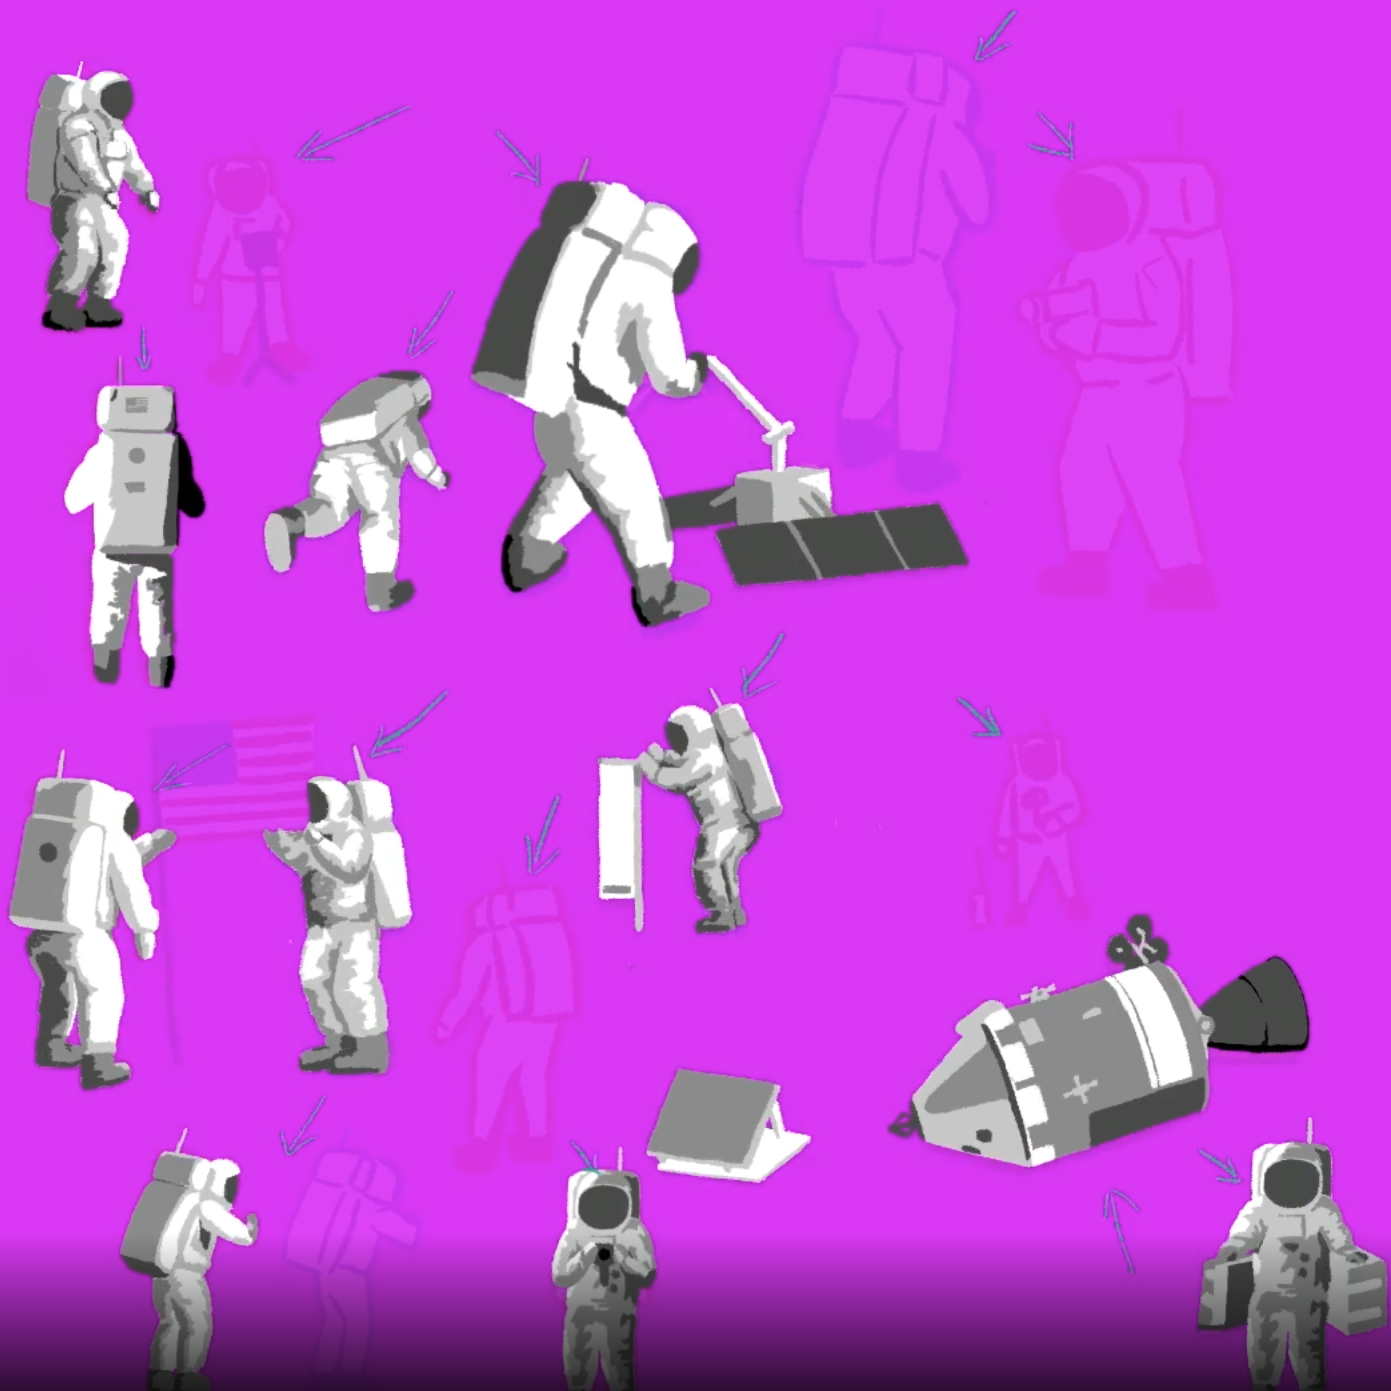
Work on the astronauts began by arranging a bunch of Apollo photos by body position. I started with actual pencil sketches to help me get a feel for drawing astros.

Eventually I created a neat digitally sketched menu of astronaut poses. I worked off of one of these poses for each of the figures in the story, modifying limbs as necessary.

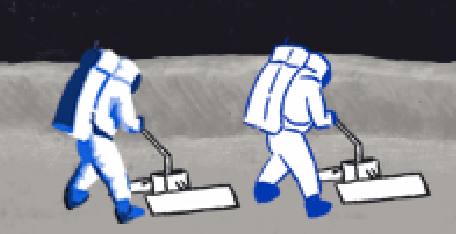
These quickly evolved to a set of red and blue line drawings, which populated early drafts of the story. Here is a meta-look at the early set of astros. Seeing them all at once helped me keep them in some sort of loose scale. It is not a perfect perspective, but an effective story perspective. Note the white background and white lander:

Early critique from friend made this story soar. One friend saw the above mock-up and made some key observations. The moon surface was the most visually heavy part of the composition when instead the astronaut action should be most salient. Also, the line-drawing style of the astros was not working at such a small scale. She suggested that I try filled drawing. I also realized the background must be black. Black diminishes the moonscape, emphasizes the astros, and connects us to the jet black background of all those iconic photos. I believe the contrast between the two styles (the original lined on right) makes a world of difference:
I had never done shaded-filled illustrations before. After a couple YouTube tutorials I took a crack at redrawing the astronauts. For reference I manipulated Apollo photos by converting them to greyscale images and making them blurry. Studying these helped my eye see which parts of their spacesuits were very bright (white), very dark (black) and somewhere in between (three shades of grey).
I drew and redrew the astronauts using these five shades. Once satisfied I colorized the greyscale to red and blue for Neil and Buzz. Below is a short screen capture of that illustration process:
The Lander got reworked too:

Experience design
The original vision for consuming the story was a flow of text and static moonscapes. The text would be styled like an interview transcript. It would be as easy as publishing an essay on Medium. But as the artwork materialized I got excited and realized there was an opportunity to create an experience that was a little more exciting.
What if the moonscape stayed anchored to better show changes between scenes? What if the text was styled like a messaging app? This new vision gave me a chance to build my first piece of interactive scrollytelling. Here is the mock-up of the scrolly idea:
I set to work. Coding began by studying Russell Goldenberg's Scrollama javascript library. I wrote a few simple functions to turn elements on and off. Keyframes send Mike Collins across the screen. A vanilla set of styles makes the messaging bubbles. Colors and fonts reference period design.
Creating a custom interactive opened doors to a lot of fun. I hid original NASA video an images via new GIFs made just for this piece. If you missed them on first read, go back to the story and hover or touch the images embedded within the conversation.
The transcript text is all hard-coded, which maybe isn't a best practice. It would be nice to have the entire transcript (shown and not) as a data-backbone. One browser dataset could drive the timeline bubbles and the text. But with all the narrative comments and general slapdash nature of these public projects, hard-coding works well-enough.
Ah yes, those timeline bubbles. The timeline below the moonscape shows a circle for each radio transmission. The circles are sized by transmission length (number of characters). I tried a number of different column bin-sizes. The final one has each column represent two minutes. Compare it, below, to a bin-size of five minutes. See see how changing bin-size changes the element's aspect ratio:
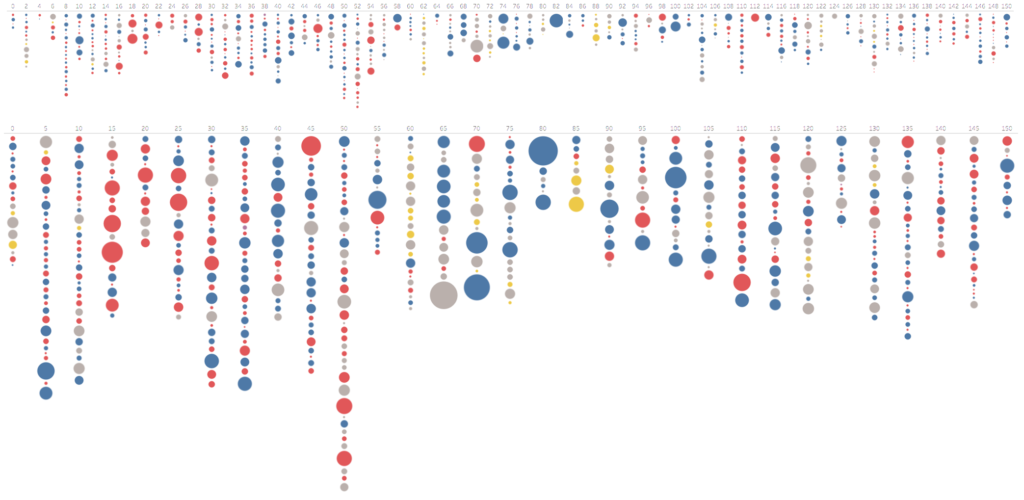
This bubble timeline proved most confusing to early viewers. They did not understand it. At best, it distracted them from the main story. It is not particularly readable on a phone.
I considered killing the bubbles. Would it still be a data story without an abstract chart? I think so. But here's the thing: I like the bubbles. I like how they look and how they balances the overall composition on a big screen. Maybe it's a case of dataViz-art more than informative data visualization. I decided to be a little stubborn. The bubbles would stay. After more iteration the final timeline design emerged. Colored-to-speaker bubbles for transmissions shown in the story. Everything else remains grey, becoming a little more salient as the story progresses:

At the very end of the story all the color rushes for the entire script. This gives a rough feel for how much everyone spoke.

At this point there is an opportunity to expand the story to an interactive visualization of the entire transcript. But that is not essential to this story. There are other better ways to experience the whole thing if that's what you really want. I believe that turning this into a full interactive would be more of a performance than it is worth.
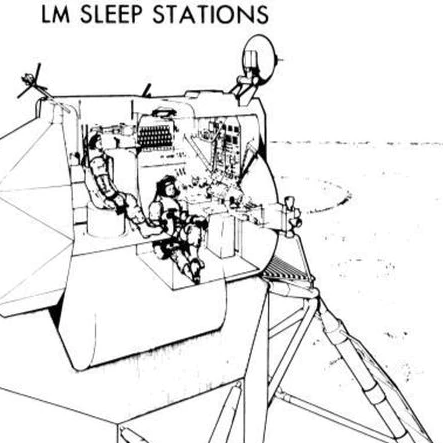
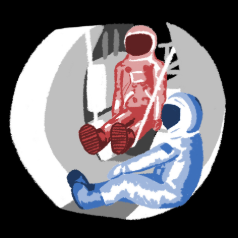
Instead it ends with a short outro. This lets me share something learned during my research that I never knew. Neil and Buzz had a slumber party on the Moon! The punctuating sketch references the original diagram of their rest positions:
Coda
I am always considering consulting on new data storytelling projects including: infographics, animations, short films, analytic maps, and other data visualization plus creation of visual language and other encoding systems. Learn more about my work for hire and reach out here.
Like many, I have been enthralled with space exploration since childhood. As a young engineer I was very lucky to work for NASA at the Kennedy Space Center during some of Shuttle's final flights. I got to spend most days outside, playing with really big toys. It was a wonderful adventure and it means so much to return to NASA data for this story.

Info We Trust (the website) is an award-winning ‘data adventure’ exploring how to better humanize information. Data storyteller RJ Andrews is based in San Francisco and the author of Info We Trust: How to Inspire the World with Data. Please let me know what you think via Twitter @infowetrust or the contact page.

No comments.