March 16, 2017Comments are off for this post.

Finding Minard

If you’ve been following the series on the history of data visualization you should know that this article - a personal tale of excitement and discovery - is a little bit different. You are welcome to go directly to the more standard module on Minard, otherwise I hope you join me for this short story of how the investigation of Charles Joseph Minard's life and work lead to a shared adventure of discovery.

The Call to Adventure

The following passage from Michael Friendly's Visions and Re-visions of Charles Joseph Minard jumped off the page when I first read it it six weeks ago:

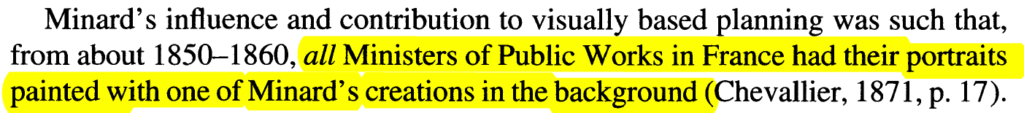
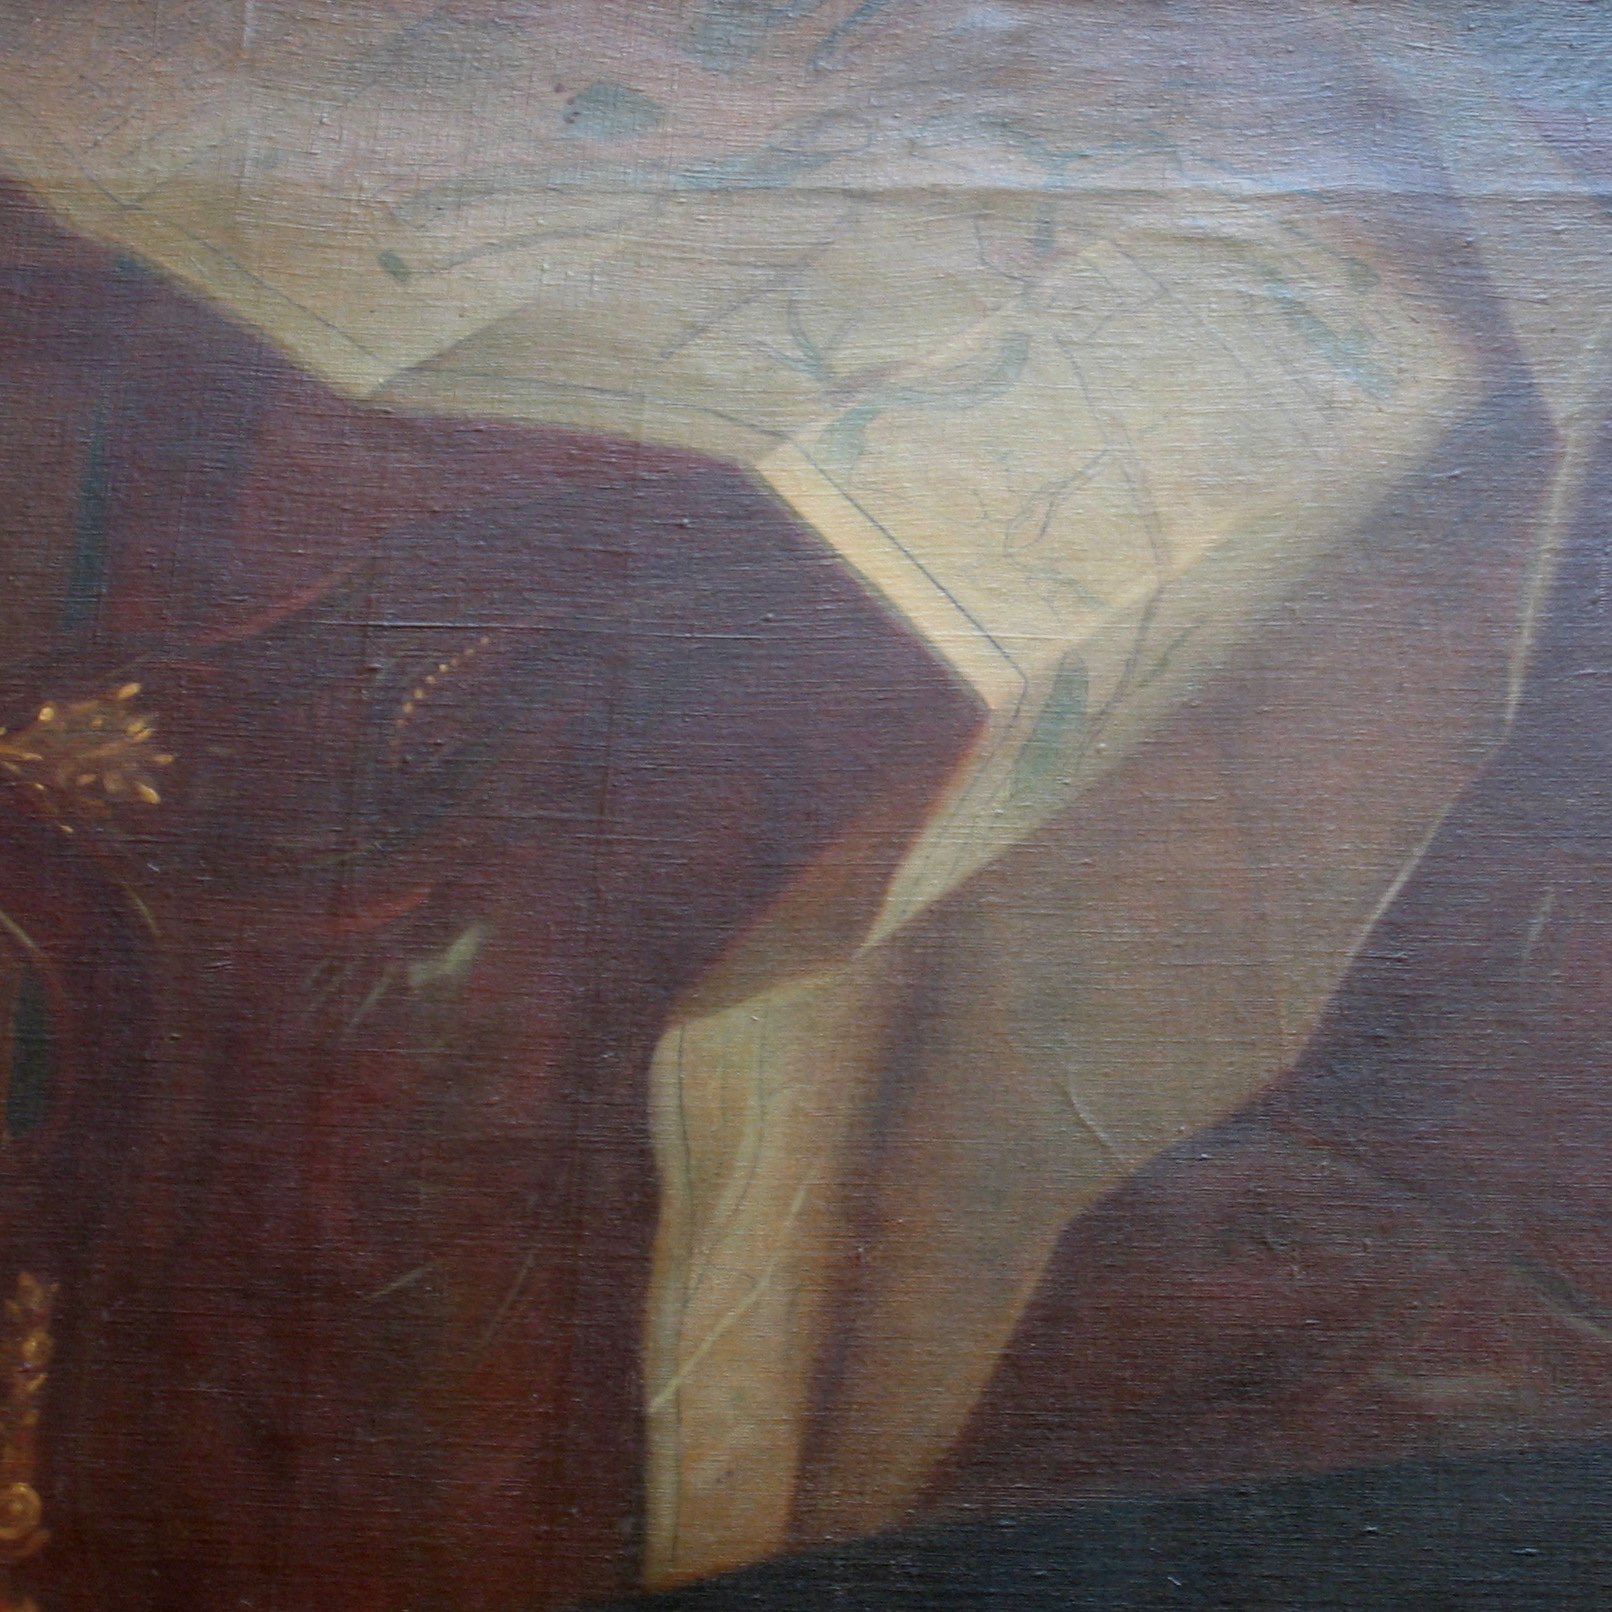
Already primed with an enthusiasm for the broader catalog of Minard's work, discovering that his contemporaries were also big fans spiked my curiosity gap. The thought that a  Minard map adorned a French oil painting in a gallery somewhere was just too rich. Read more

March 15, 2017Comments are off for this post.

Seeking Minard

After examining the history of data visualization greats I have decided to collect my learnings in the style of history’s data visualization greats. The fifth of these visual summaries is presented and discussed below. You can explore the entire series here.

Minard. Carte des quantités de viande. 1858.

The large thematic map above shows the home country of 300 years worth of European data visualization pioneers, in the style of Charles Joseph Minard's 1858 quantités de viande examination of the supply of meat to Paris - the first work to size pie chart bubbles and place them on a map. I have so much to get to about Minard beyond this little map Read more

January 24, 2017Comments are off for this post.

Out of the Swamp

After examining the history of data visualization greats I have decided to collect my learnings in the style of history’s data visualization greats. The fourth of these visual summaries is presented and discussed below. You can explore the entire series here.

A pair of pages describe early data visualization pioneers, binned by the age at which they first published a significant chart, Read more

January 19, 2017Comments are off for this post.

Population Cosmos

After examining the history of data visualization greats I have decided to collect my learnings in the style of history’s data visualization greats. The third of these visual summaries is presented and discussed below. You can explore the entire series here.

Stacked bars allow comparison across nations of the total number of early data visualization pioneers,  Read more

January 12, 2017Comments are off for this post.

Chart-maker Biography

After examining the history of data visualization greats I have decided to collect my learnings in the style of history’s data visualization greats. The second of these visual summaries is presented and discussed below. You can explore the entire series here.

Timeline bars to show you the lives Read more

January 9, 2017Comments are off for this post.

History of Infographics

Explore the History of Infographics Interactive

The below work was translated to an interactive experience which you can enjoy by clicking the link above.


January 2017 Static Poster Design Essay

After examining the history of data visualization greats I have decided to collect my learnings in the style of history’s data visualization greats. The first of these visual summaries is presented and discussed below. You can explore the entire series here.

A map to guide you through the early developments of data visualization, including cartoons of 84 key charts, in the style of John Ogilby's 1675 Road Atlas. This image is sized for web-consumption and is only a fraction of the actual piece which can be properly enjoyed via:

ACCESS BIG 31mb JPG HERE

Read more

infowetrust-white

Contact
San Francisco, CA
©2013–2024 RJ Andrews