Work with RJ Andrews
Humanize data. See the world.
I help organizations communicate data with clarity and persuasion using visual metaphors and information graphics: charts, maps and diagrams. Typical engagements include workshops, keynotes, and hands-on consulting for high-stakes efforts.
You don't have a data problem—
you're failing to communicate your data.
INFORMATION DESIGN IS A SOCIAL TOOL
Attract Attention
Make the important part impossible to ignore. Charts captivate and engage by focusing attention to the story, building trust with their clarity and impact.
Signal Worth
Show that it's careful, credible, and intentional. Sophisticated graphics are cultural expressions that signal a story is worth an audience’s consideration.
Grasp Context
A shared map for understanding complex information gets everyone on the same page about the broader situation.


Ways to work together
From a single keynote to a multi-week design build.
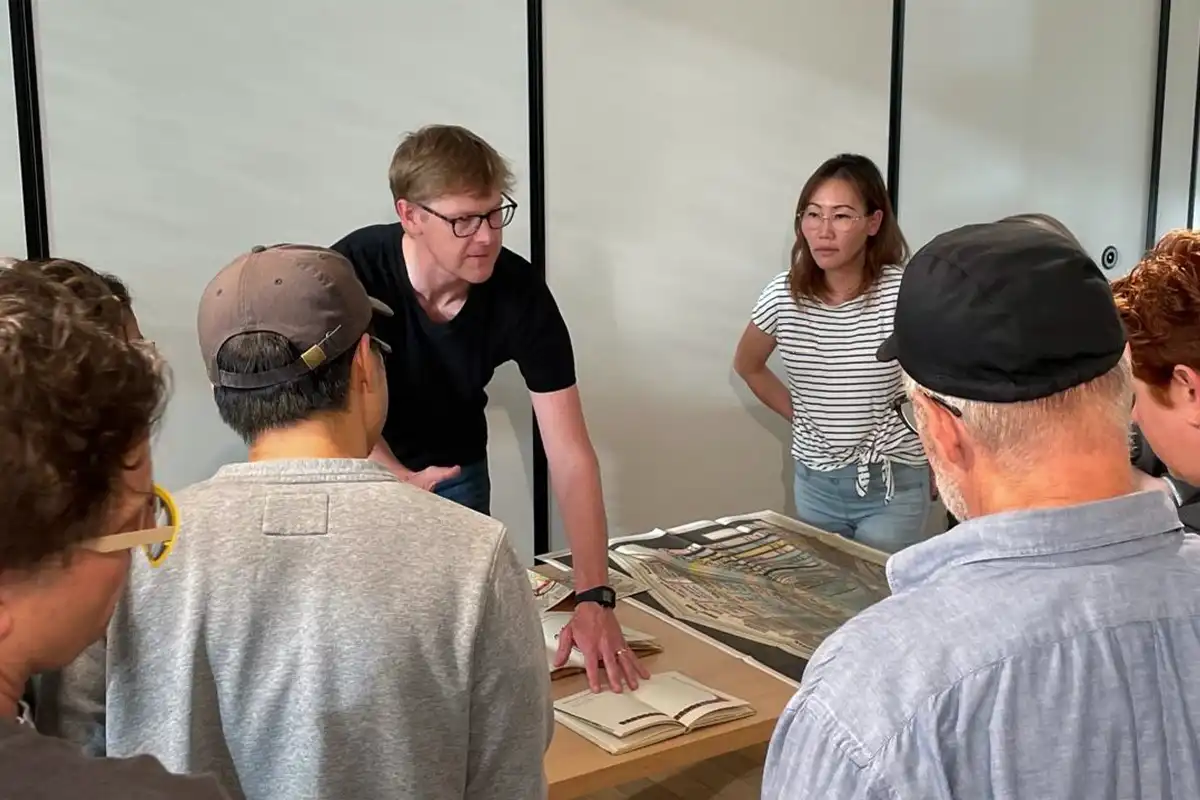
Workshops
Hands-on training for teams. Outcome: a shared visual language + immediate practice.
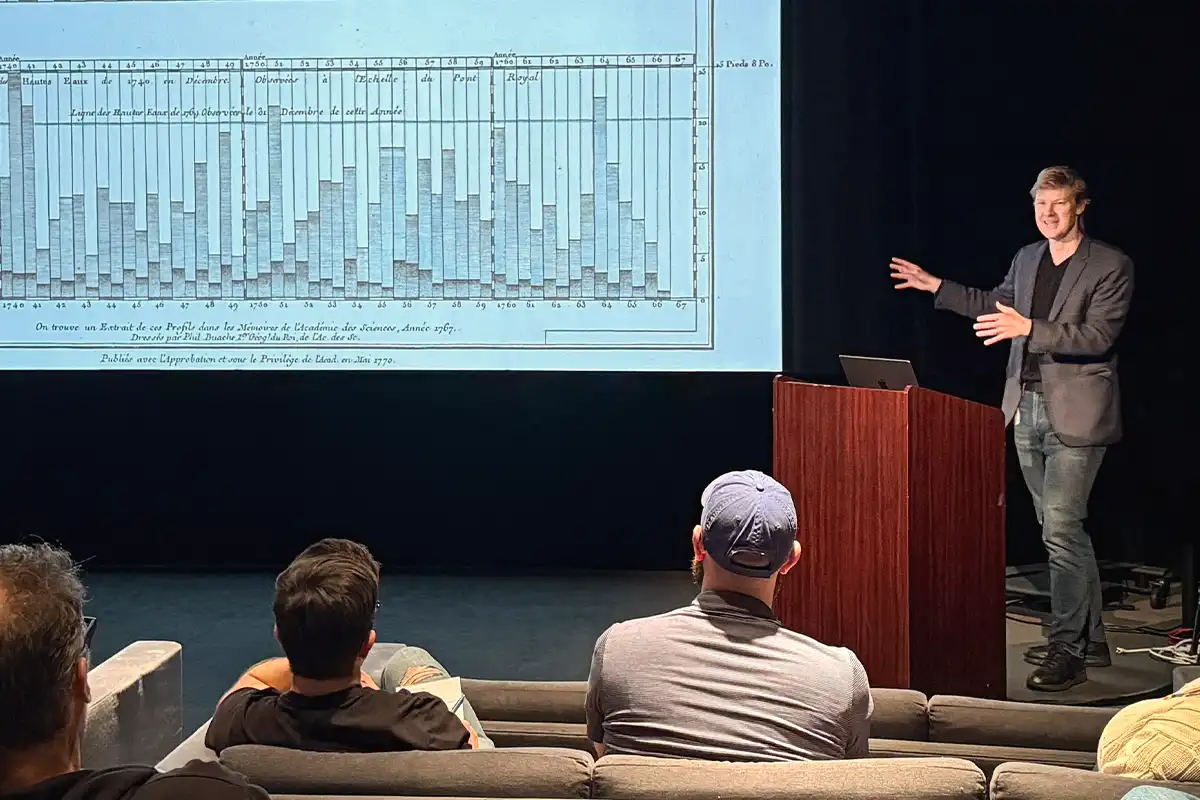
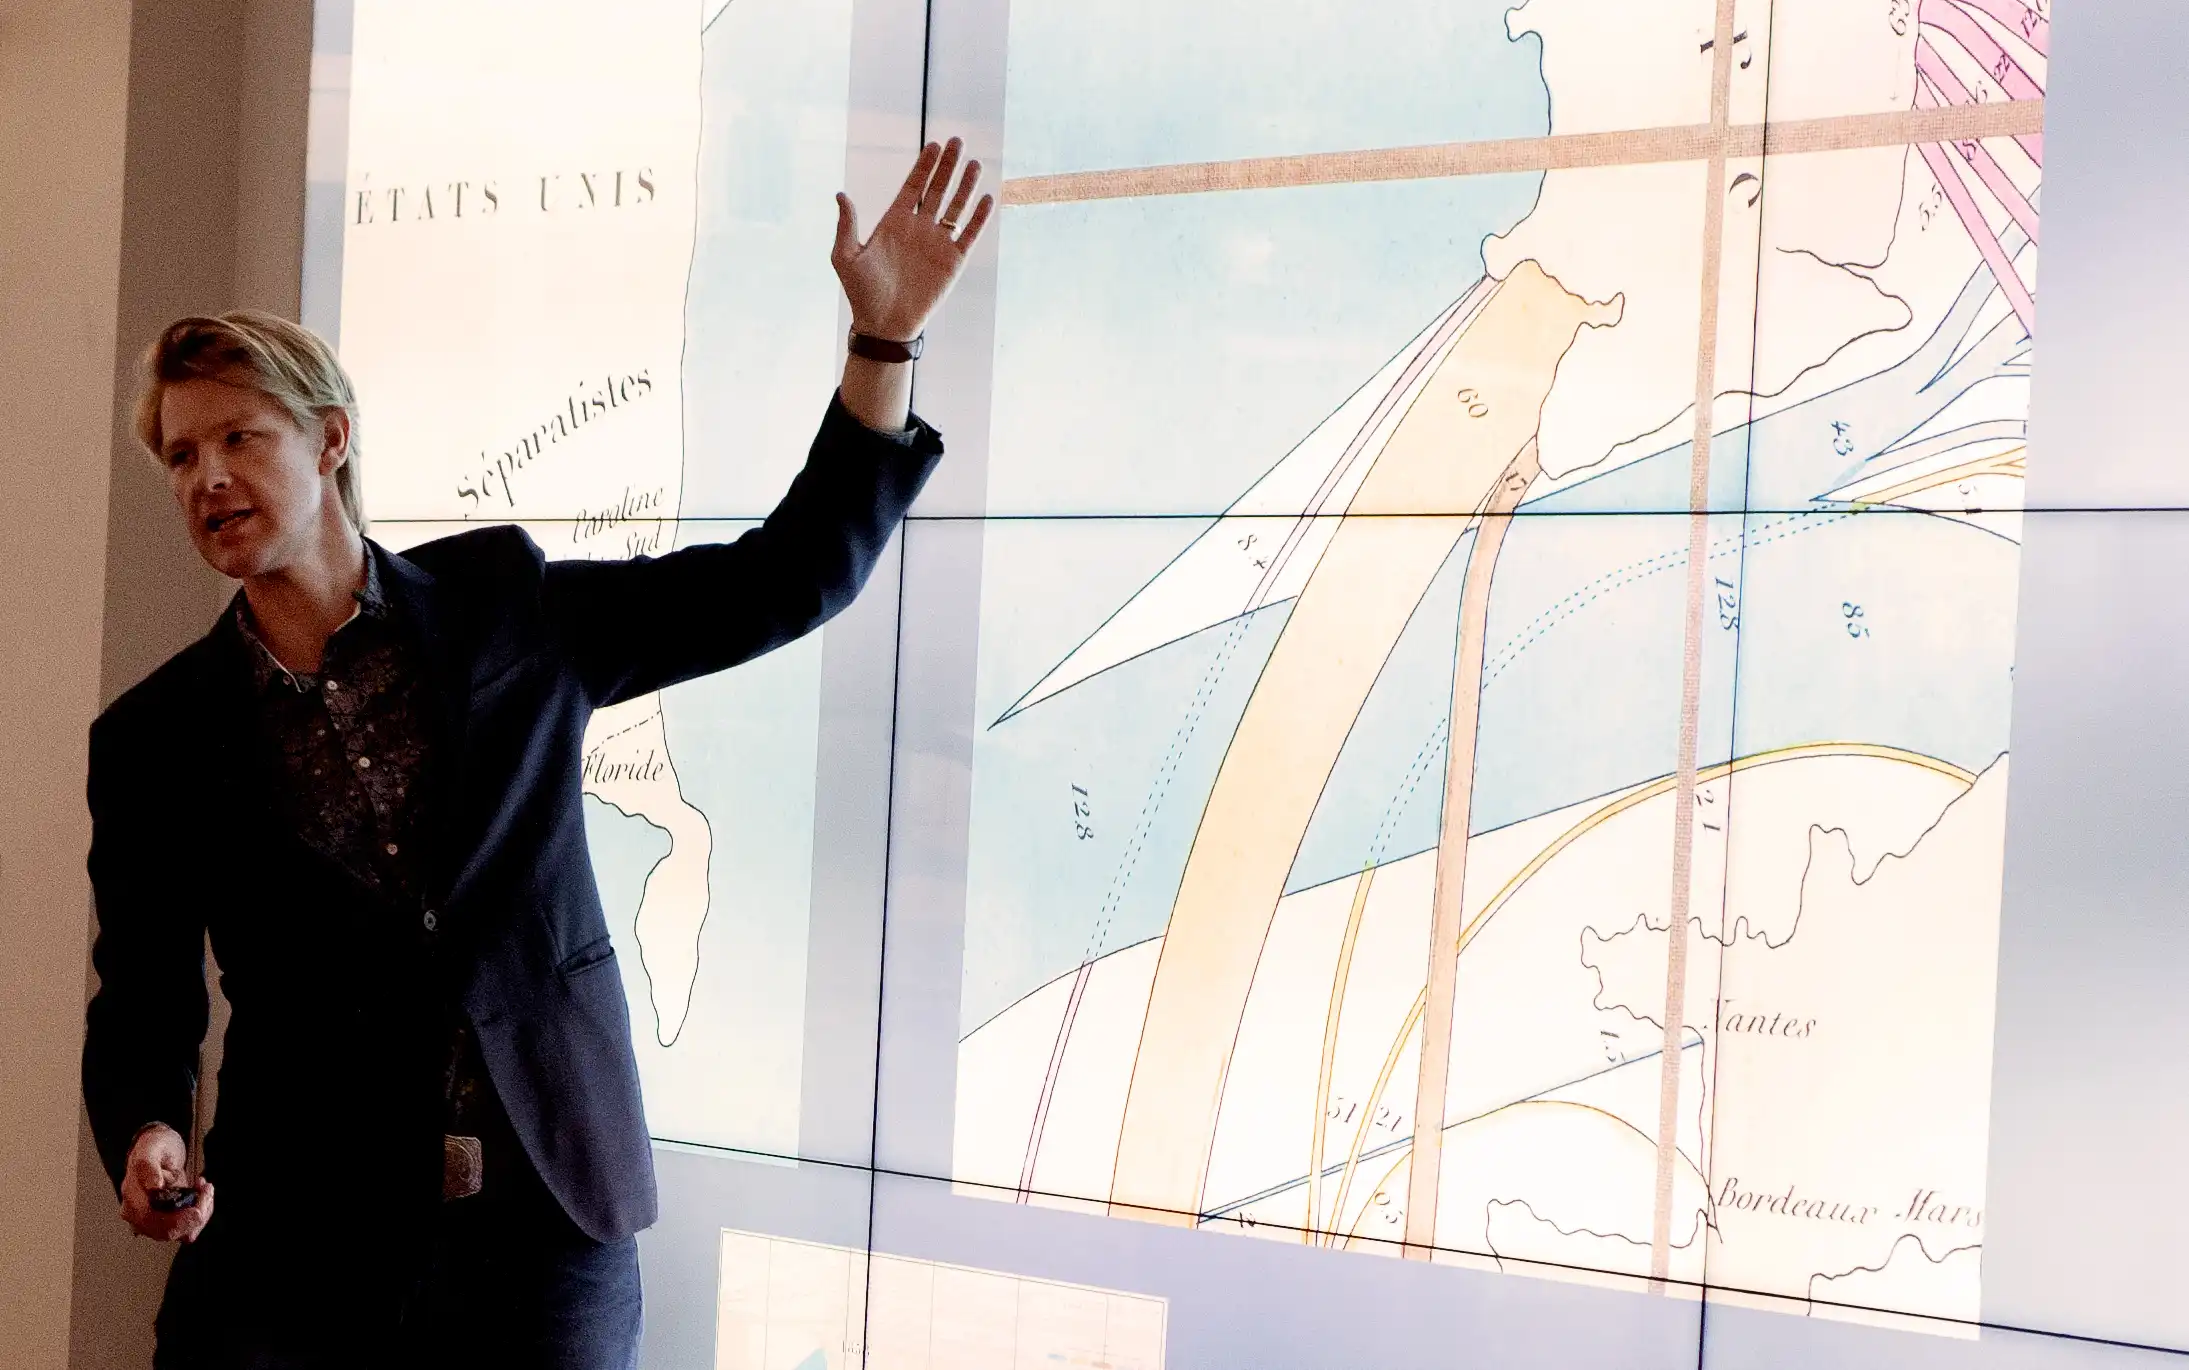
Speaking
Inspiring keynotes and talks on the craft and history of information graphics (grounded in rare artifacts).
Consulting
High-stakes visual explanations, narrative graphics, and designs systems (from concept to implementation).
"This is the graph I've been looking for. I'm in love with this chart. Thoughtful! Creative! On-point! Efficient!"
—National Academy of Sciences client
Selected work
I’m grateful for the places charts have taken me. Here’s a small sample—public, private, and published.
PUBLIC PROJECTS
Creative coding
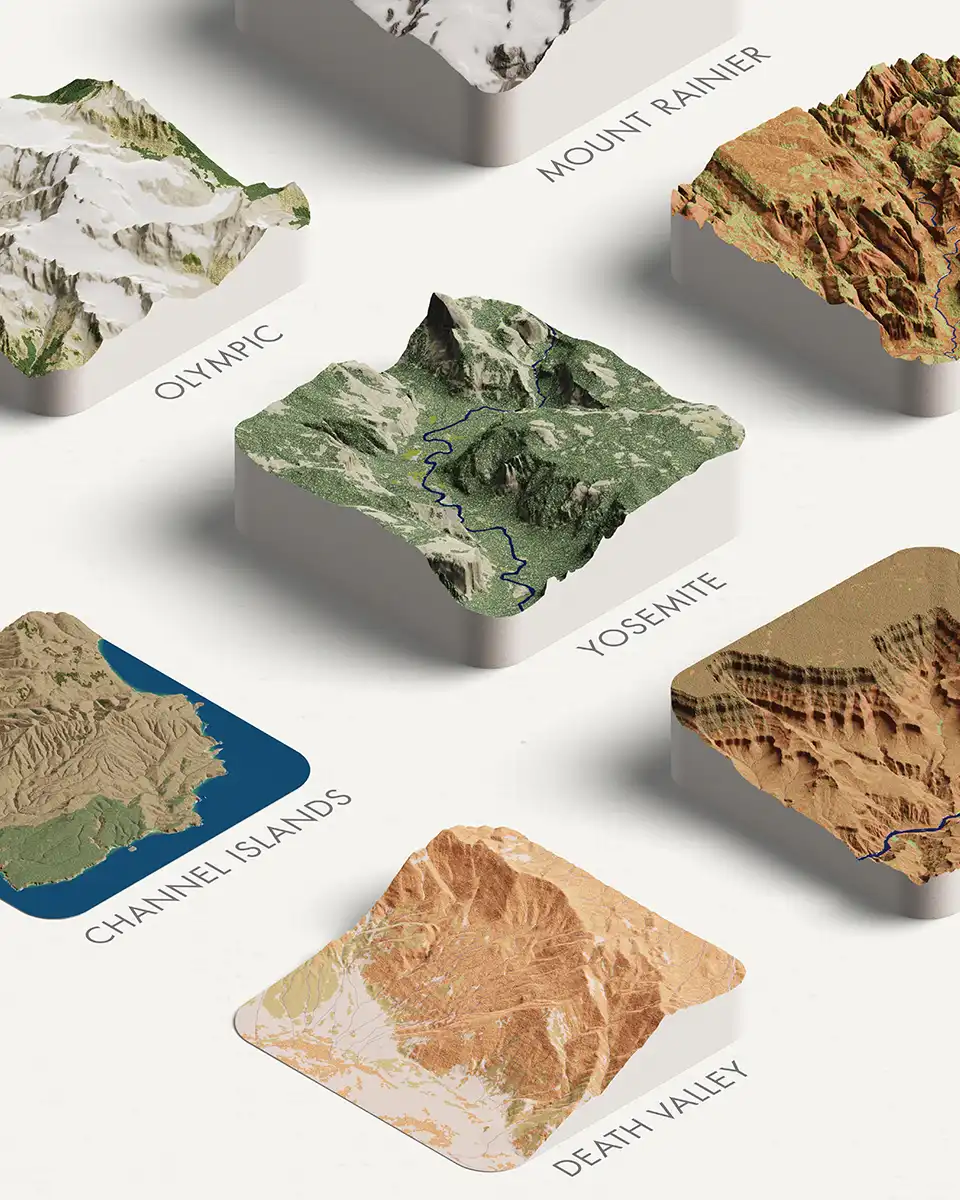
Delicious Parks
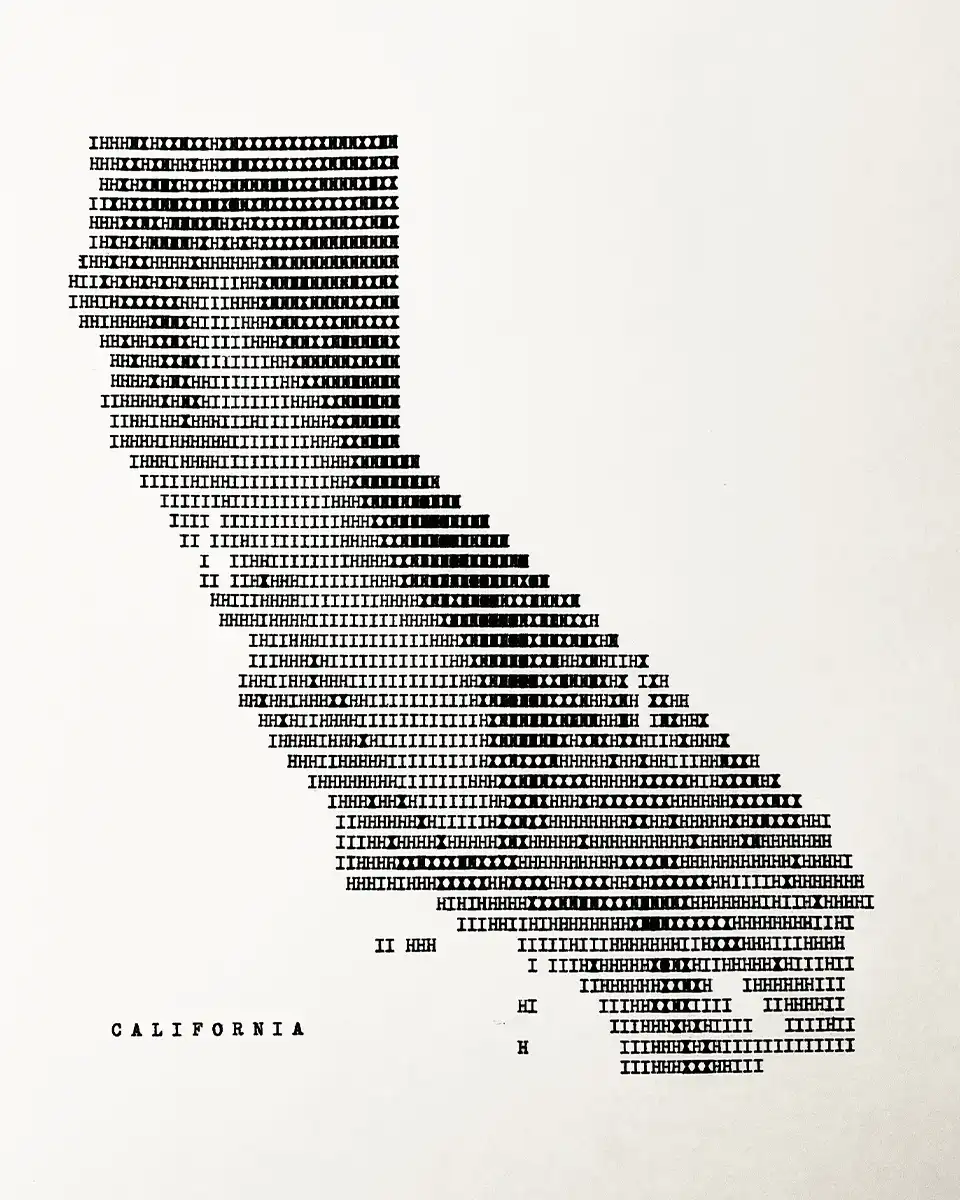
Hand-typed California
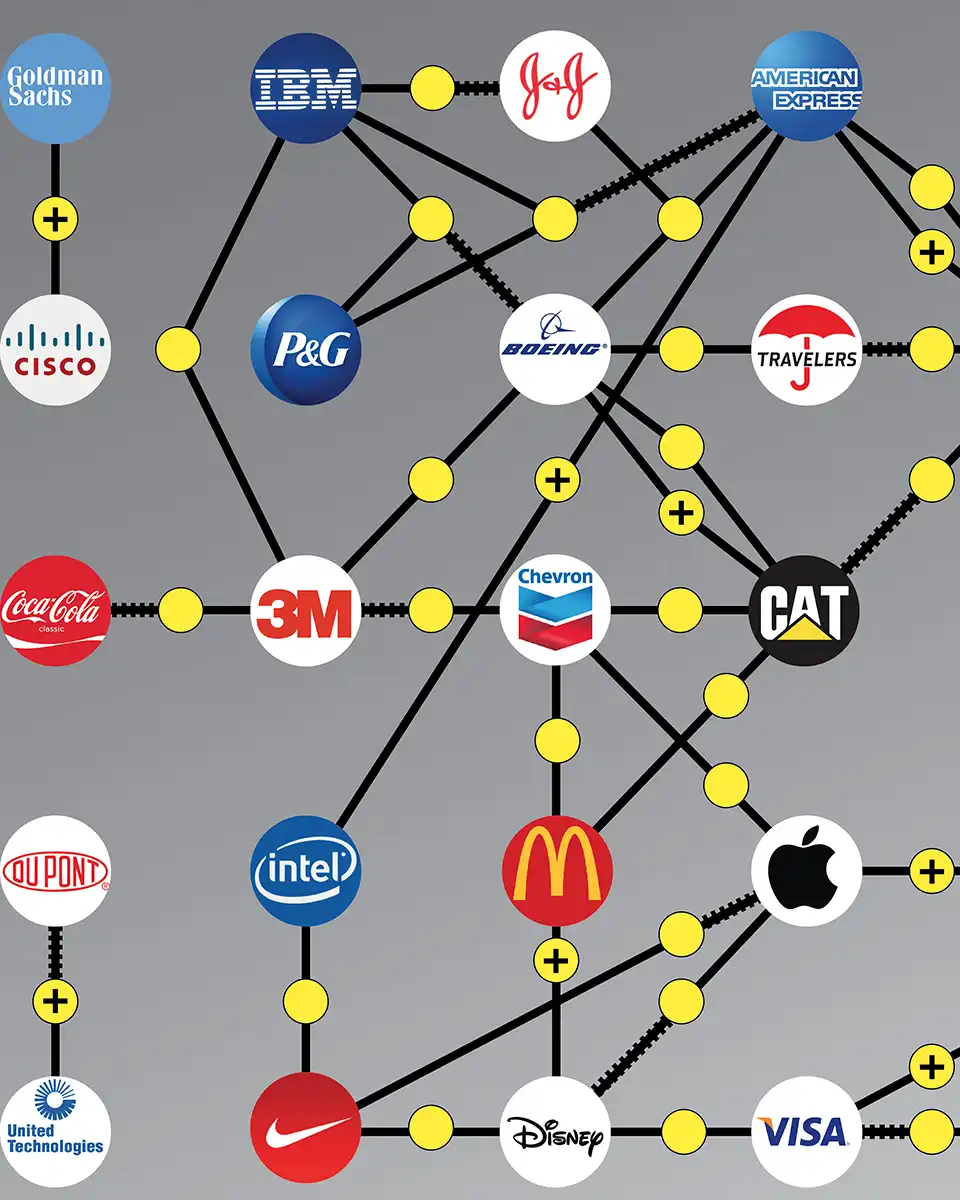
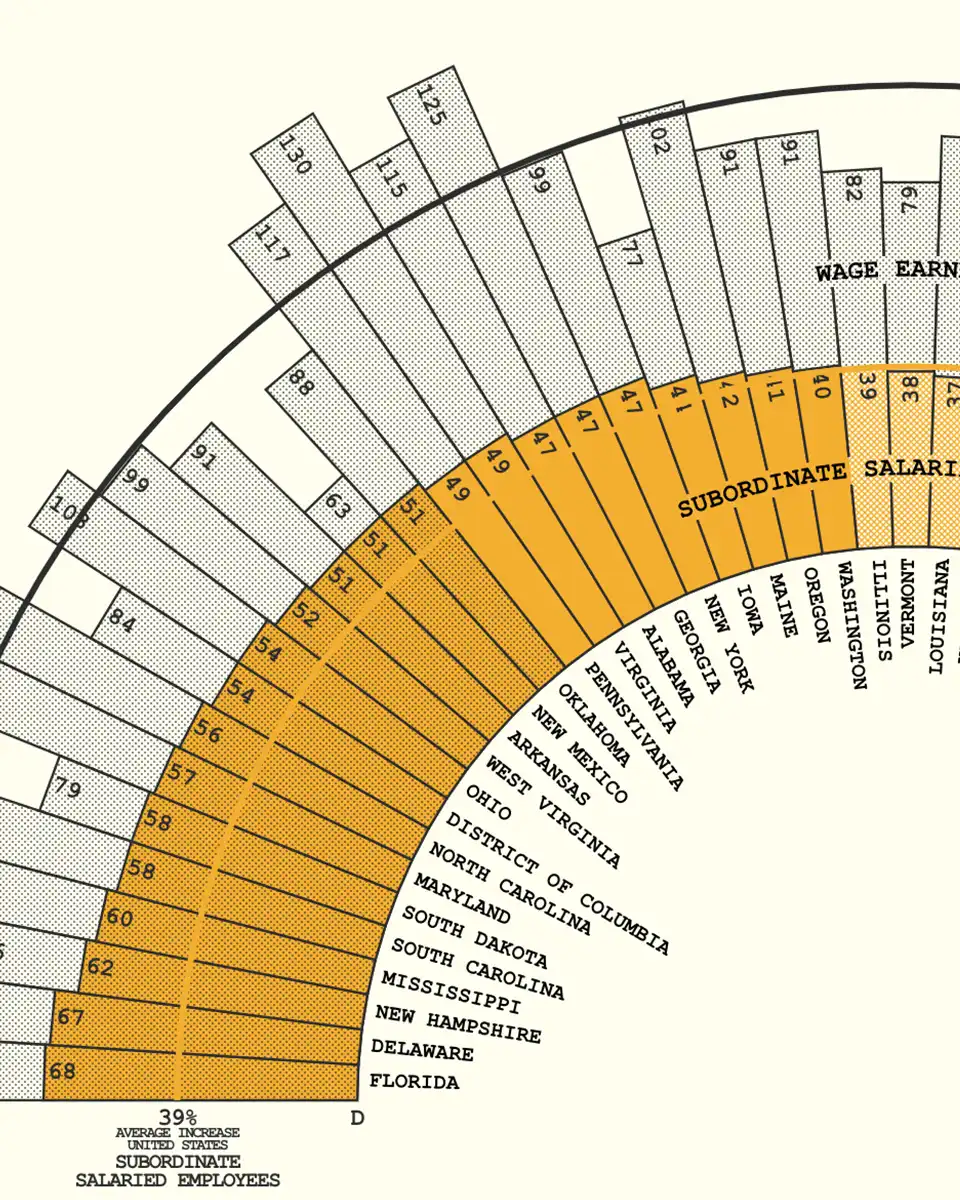
Board Overlap
CONFIDENTIAL ENGAGEMENTS
Anonymized examples of recent engagements.
Map prototyping
Developed ways to layer richer data into the world's leading mapping platform.
Profitability modeling
Built multifactor operations insights for a global consulting practice.
Investment analytics
Designed decision tools and reporting for a venture capital firm.
A FEW PLACES I’VE PRESENTED OR DELIVERED WORK


IN LIBRARIES & COLLECTIONS
My books are enoyed by many institutions, including:
American Philosophical Society, Boston Public Library, David Rumsey Map Collection, Letterform Archive, Library Company of Philadelphia, MIT, Newberry Library, Princeton University, Quentin Blake Centre for Illustration, Tokyo Keizai University, University of Toronto, UCLA Library, Utrecht University Library, Zentralbibliothek Zürich.
VISIONARY PRESS ↗
Consulting Methodology
Together we create useful comparisons that help groups navigate nuance, complexity, and insight. While every project is unique, typical stages include:
1
Establish
Set the stage with available resources and desired information goals.
2
Explore
Creative probing through analysis, concept sketching, and prototyping.
3
Focus
Refine findings into a coherent package for intended audience.
4
Deliver
Final designs ready for implementation.
RECENTLY USED TOOLS
Paper and pencil are used in every project. Beyond these, I am technologically agnostic, designing with whatever best fits the goal.


FAQ
Deliverables are fit to your need: A visual narrative that persuades. A reusable chart system. A new shared understanding. A clear next step for your team.
How long? Starter workshops are half-day (3 hours of content) and full-day (6 hours). Speaking engagements are 45–60 minutes plus Q and A. First consulting engagements typically range from 2 to 8 weeks.
Where? Virtual, in-person, and blends are possible. RJ is based in San Francisco.
How much? Pricing is scoped to the problem.
Powerful graphics bring data to life.
In our introductory conversation we will start by establishing your information goals.

Info We Trust and Visionary Press are DBAs of Information Productions LLC, San Francisco.
Info We Trust ® is a registered service mark. © 2013–2026 RJ Andrews.