Data Storytelling.
A workshop for professionals about how to create value with data graphics.
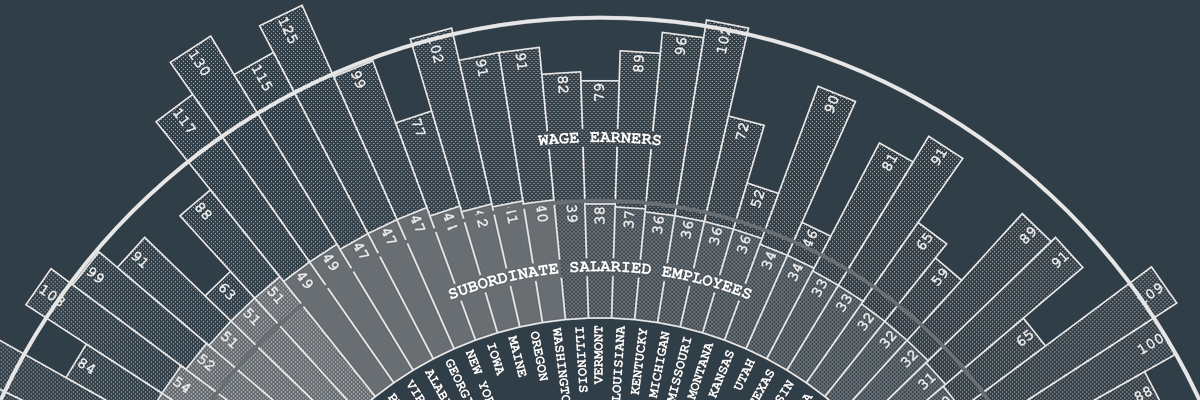
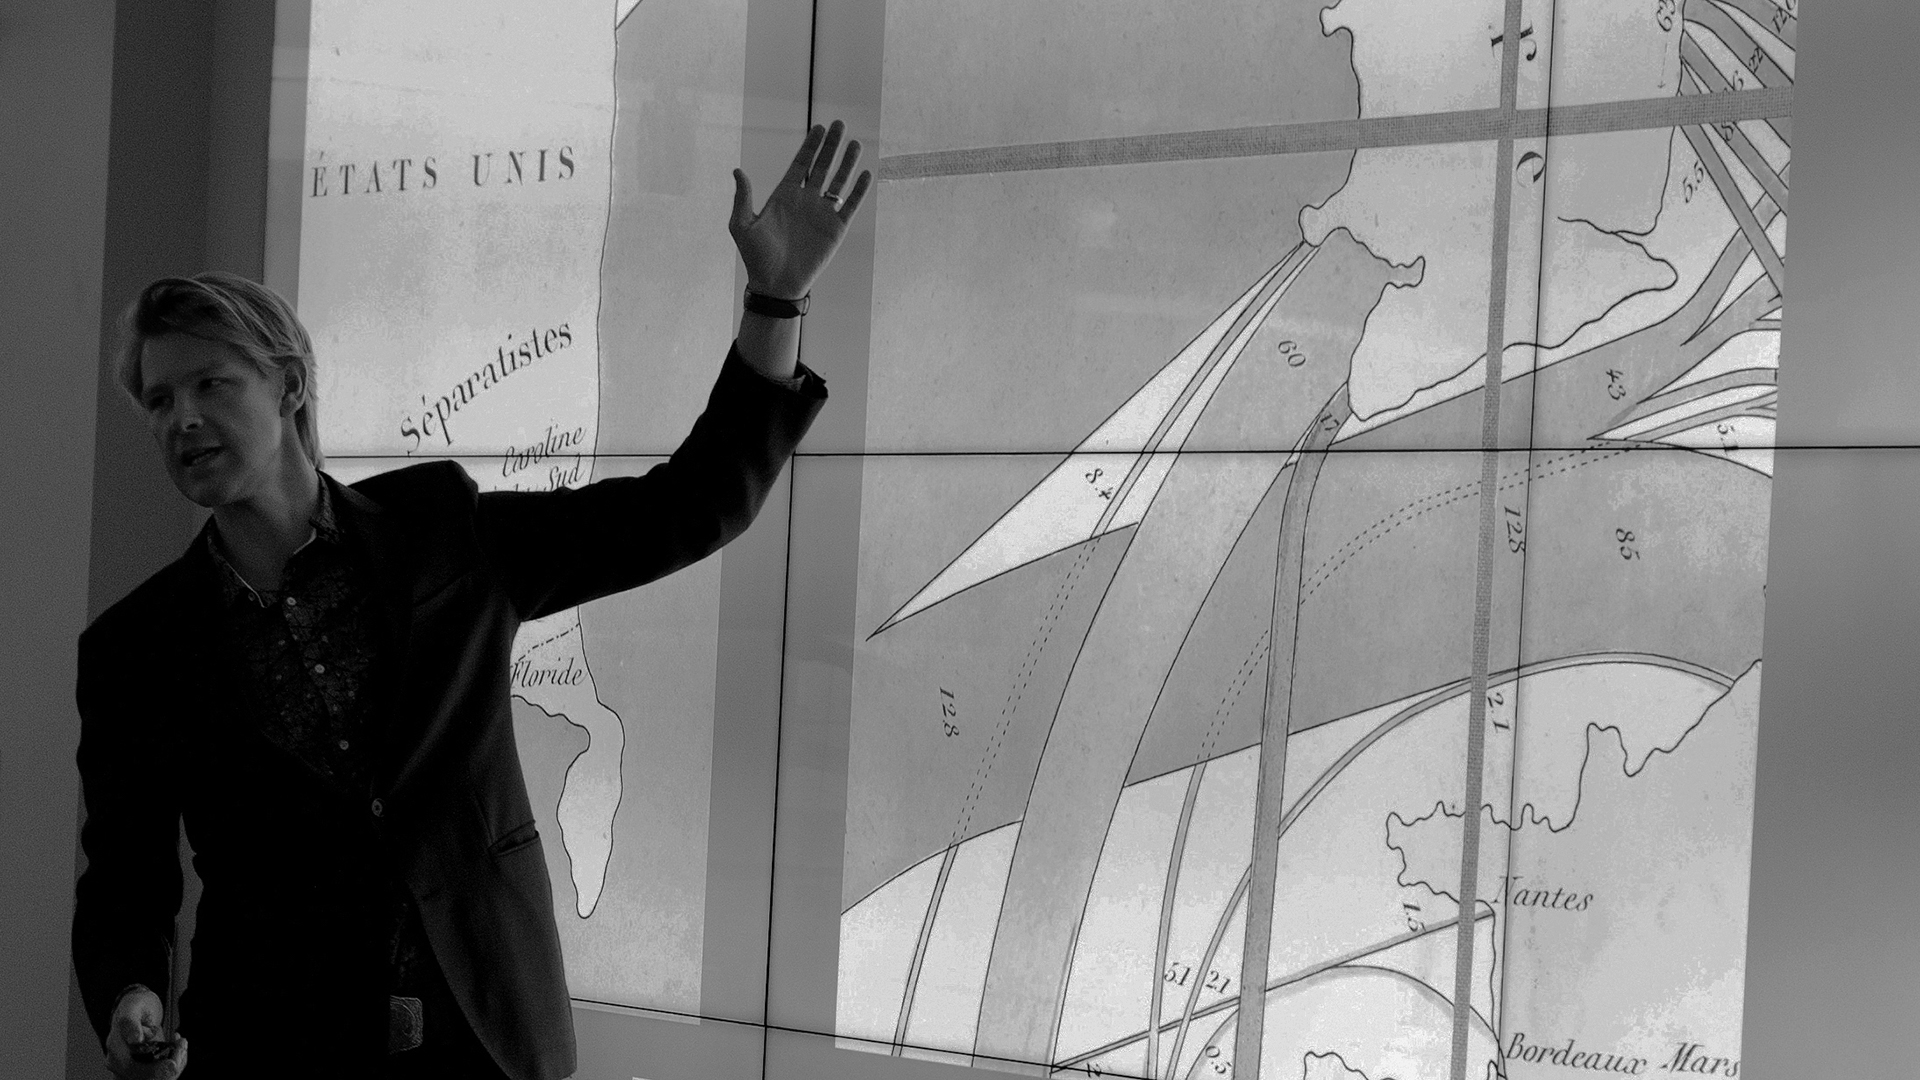
Data graphics are magical. More than just analysis and insight—information design is most powerful as a social tool.
Learn how to make pictures that can help us discover and discuss otherwise invisible phenomena. We will focus on data visualization while also exploring lessons from storytelling, writing, maps, and more.
Powerful graphics bring data to life.
"An incredible journey with a master data storyteller."
"RJ lets you—leads you—to discover by his side."
"Inspires me to push harder in my own work."
Workshop Details
Our focus is how to attract attention, sustain engagement, and inform people with data. Our attitude is anchored in human perceptoin, not any particular technology.
Whether data-veteran or data-novice, you will gain powerful knowledge for analysis and persuasion. Engineers, managers, marketers, researchers, designers, analysts, curators, librarians, and many more have benefited from learning about data storytelling.
This workshop is taught by RJ Andrews. He helps organizations solve high-stakes problems by using visual metaphors and information graphics: charts, diagrams, and maps. He recently produced designs for The White House, Google, and MIT.
The content of your data storytelling workshop will be tailored to your needs based on a planning discussion. Together we will determine the right mix of topics, lectures, activities, and group discussion. If desired, we can critique and explore your specific data storytelling projects.
Each workshop is unique to the audience's needs. The following two description are from real workshops.
One-Day Workshop
This schedule is from a recent fast-paced day in NYC with a team of engineers, designers, and product managers.
8:45am - 9:30am
Welcome and light breakfast
9:30am - 9:45am
Orientation
A multimedia introduction to data storytelling and the day's plan.
9:45am - 10:05am
How we got here
Learn from and be inspired by the pioneers from information graphic history.
10:05am - 10:30am
Building blocks
Consider how audiences think about (and see) time, space, and importance. Understand how to create meaning by analysing familiar chart types.
10:30am - 10:45am
Reading charts
Reinforce with group critique of how basic charts are used in familiar consumer apps.
10:45am - 11:00am
15 minute break
11:00am - 11:15am
Philosophy of information
Distinguish data from information as we think about what it means to inform viewers.
11:15am - 11:45am
Visual analysis
Advanced techniques to help surface what you do not expect to see.
11:45am - 12:00pm
Experience design
Storytelling techniques to engage emotions, focus attention, and promote action.
12:00pm - 12:15pm
Interaction design
How to use interaction for detail, exploration, narrative, and delight.
12:15pm - 12:30pm
Creative workflow
Best practices for inventing new ways of looking at data.
12:30pm - 1:30pm
Lunch discussion
1:30pm - 4:00pm
Design critique
Host team presents information product designs for discussion. Together we probe conceptual frameworks, answer questions about chart implementation, and set a new course toward implementing better data storytelling.
4:00pm - 5:00pm
Product troubleshooting
One-on-one discussion with lead engineer
Four-Session Workshop
This description is from a recent workshop taught over four 3-hour sessions in San Francisco.
We will dissect the elements that make data graphics spectacular, ranging from choosing effective visual metaphors to picturing uncertainty and the subtle art of color-encoding. We will critique and we will make. Our emphasis will be on the hard human decisions necessary to create effective data graphics.
Each session will focus on a specific aspect of information design:
- Visual metaphors
- Comparisons
- Process
- Value creation
We will discuss not just the aspects that make masterpieces of information design effective, but also the craft and context of its creation, gaining insights into how great information design actually happens. By the end of the class we will have studied bar charts, line graphs, thematic maps, color engineering, table design, and lots more.
Learning outcomes include:
- Choose an appropriate visual metaphor for a chart
- Convey insights by creating engaging comparisons
- Appreciate the design process necessary to inform
Sessions will include data-sketching warm-ups, presentation of information-design theory, and review of take-home exercises. We will learn through mutual reflection and constructive critique of one another’s work. The engaged student will emerge from the class with more capabilities and enthusiasm for data graphics.
Your Instructor
Award-winning data storyteller RJ Andrews is obsessed with data graphics.
He helps organizations solve high-stakes problems with visual metaphors and persuasive graphics. He recently produced designs for The White House, Google, and MIT. See selected public projects.
RJ's newest book is Info We Trust: How to Create Value with Data Graphics. He is also author of Florence Nightingale: Mortality and Health Diagrams and co-translator of Étienne-Jules Marey: The Graphic Method. In 2022, he published Information Graphic Visionaries, a series celebrating spectacular data-visualization creators.
RJ lives/works in the Dogpatch neighborhood of San Francisco. Learn more about him the about page.
Ready?
Let's talk about a data storytelling workshop for you.

Alternatively, use the contact form below.

Info We Trust and Visionary Press are DBAs of Information Productions LLC, San Francisco.
Info We Trust ® is a registered service mark. © 2013–2026 RJ Andrews.