Charts!
Pixel-perfect bars and curves
Analog excellence digitized for the web.

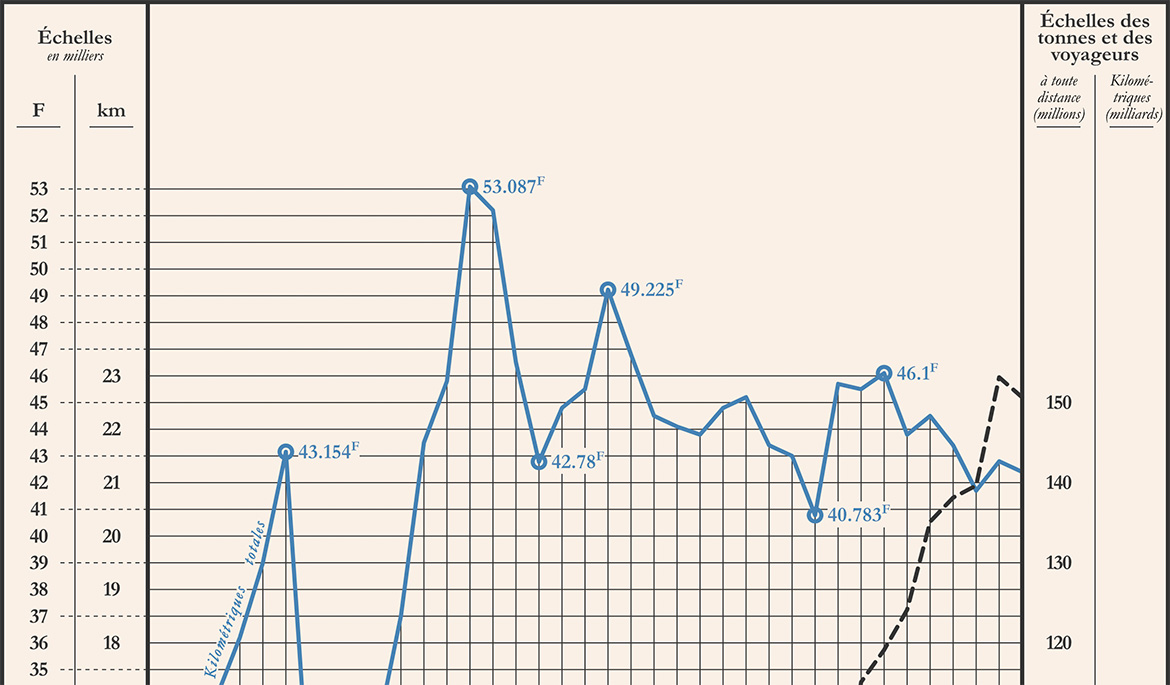
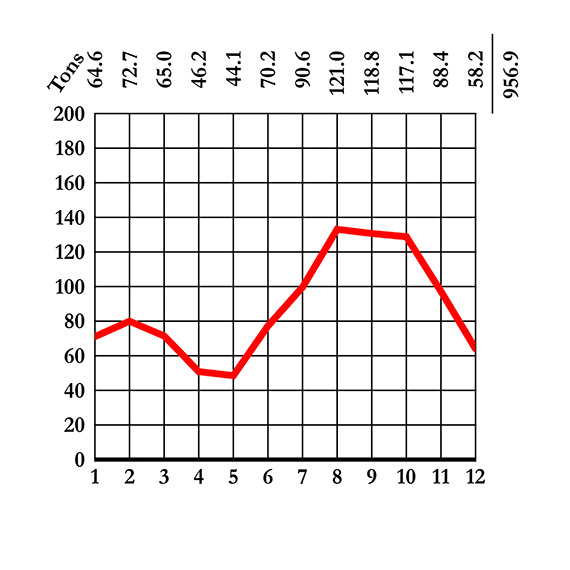
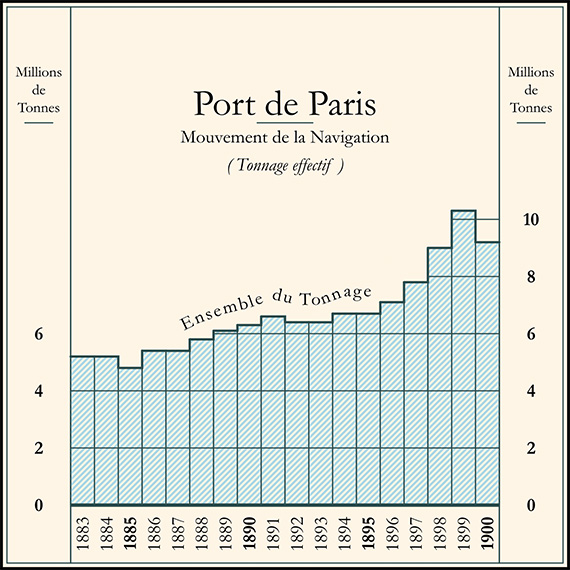
The history of information design boasts many techniques that have disappeared from modern practice. These include ways to better convey data with axes, annotations, and marks.
Charts! is an ongoing series that revives these forgotten flourishes. It seeks to elevate the execution of workhorse statistcal graphics, like bar charts and line graphs. It reveals that we have more choice in how we create than most modern charting software and libraries would have you believe.
Each entry is accompanied by a short essay. See them all at charts.infowetrust.com

